Drone-based remote sensing at Halos, Greece

Elon Heymans and Jitte Waagen

Drones are gaining ground as a versatile tool for archaeological prospection. Cheaper and more efficient in use than conventional airplanes, high-end drones available on the consumer market can be mounted with different cameras and sensors, thereby creating what is essentially a flying modular remote sensing lab.

The advantages of drone-based prospection versus traditional methods in terms of logistic- and cost-efficiency, make it an attractive tool for exploring archaeological landscapes. Moreover, a drone can fly at different altitudes, unhampered by vegetation or relief, and because all it really needs is a charged set of batteries, it can carry out many survey flights collecting a large amount of data. These advantages make drones particularly suitable for experimental research setups that that facilitate a steep methodological learning curve and allow for the development of best practices, while at the same time contributing to site-specific research questions.

Testing Ground: Ancient Halos

The archaeological landscape of ancient Halos in central Greece provides a good testing ground for the possibilities that drone-based prospection has to offer. Dutch archaeologists from Groningen (RUG) and later Amsterdam (UvA), in collaboration with colleagues of the Greek Archaeological Service (the Ephorate of Volos), have been active in the region for over 40 years; and also work carried out by the Archaeological Service around the construction of the Athens-Thessaloniki highway has contributed much to our knowledge of the area.

Halos is mentioned already in Homer’s Iliad, yet research has not really been able to identify a settlement centre for the Iron Age (12th – 8th century BCE). As confirmed by later sources, it is likely that during the course of the Iron Age and archaic period Halos emerged as an independent political community, a Greek polis. Yet, how this community of citizens really came about is not completely clear. A large funerary plain measuring over 200 ha and used by people living in the surrounding area between the 12th and 6th century BCE can offer an important view on how this landscape was used through time and how people came together thereby shaping new and collective identities.

The Voulokaliva Funerary Landscape

While the area boasts virtually no substantial Iron Age settlement remains, this funerary plain, known as the Voulokaliva, is one of the largest Iron Age cemeteries in Greece. It is dotted with over thirty tumuli, some of which remain more or less intact (although their preservation is under pressure due to continued agriculture), and can often be recognised as a scatter of stones or elevated stone heaps, resulting from the fact that farmers plough out large stones, which are then deposited together. Other tumuli have been looted or excavated (Stissi et al. 2004). In a single instance, an excavated tumulus (site 36) contained 74 cremation burials, made over the course of several centuries, with the tumulus (eventually) being closed off with a cover of small stones (Lagia et al. 2013). Moreover, excavations carried out along the route of the highway suggest a spread of single burials in between the mounds.

Drone Remote Sensing
A Google Earth generated image overlooking the Almyros plain and the Pagasitic gulf to the northeast with the city of Volos in the centre on the other side of the gulf and the acropolis of Hellenistic Halos at the bottom. The Voulokaliva is located adjacent to the highway; Magoula Plataniotiki is located closer to the coast
A drone photo of the Voulokaliva looking in western direction with the nearby village of Neos Platanos beyond the highway, several arrows indicate visible tumulus sites

Drones aloft

While a better understanding of this extensive area is key to answering important historical questions, we also have a lot to learn from the process of researching it, not only in developing and finetuning our methods, but also in mapping the area and thereby complementing earlier survey and excavations. This is done by collecting large numbers of images with sufficient overlap and processing these into detailed 3D models that can be further analysed but also offer new visualisations. Using dGPS measured targets (mounted onto 1x1m aluminum plates) that can be easily identified in the images, these models have a high level of precision and can be placed in a GIS (Waagen 2019). In order to contribute to our understanding of the area as part of the study of the field survey data, we have focused our efforts on six areas or test sites, also included in the survey. Four of these (A–D) contain clusters of tumuli, giving the possibility to take a detailed look at these sites, while not losing sight of potential ‘off-site’ remains. The remaining two test sites are settlements: a small prehistoric settlement site located on the southern end of the Voulokaliva (site 35), and the Classical/Hellenistic settlement at the nearby tell-site of Magoula Plataniotiki, where excavations have been ongoing since 2013.

Thermography

Our approach uses thermal infrared imaging as a remote sensing technique. By measuring minute temperature differences on the surface, an advanced thermal camera can document material differences in the soil, including potential subsurface archaeological remains (Casana et al. 2017). Think of the fact that on a sunny day, a car can turn hot enough to fry an egg on its hood, but a grassy lawn would still stay cool. This is simply because some materials can easily heat up in the sun (due to their high thermal conductivity), and retain and emit a lot of heat (i.e. high heat capacity and thermal emissivity), while others (notably water) are more resistant to temperature fluctuations (something known as thermal inertia). Because different materials, due to variation in composition, density, moisture content, conductivity of the matrix etc, respond differently to temperature fluctuations, we can observe differences in the pace at which they heat up and cool down again. Such differences result from the diurnal flux (the difference between day and night), but are also affected by longer term (weeks) temperature fluctuations.

An Experimental Workflow

As the reflection of sunlight has a large impact on the measurable thermal radiation, the theory prescribes that it is best to fly between sunset and sunrise. Because the clarity of a thermal signal results from a variety of factors, our strategy is to collect data at different times during the night (after sunset, in the middle of the night and before sunrise) and in different times of the year (July, November and April). Collecting data under all these different circumstances allows us to systematically compare the images that we have. This is a versatile approach because comparing images recorded under different circumstances helps us to understand and interpret what we are seeing, but also because it enables us to understand what conditions are most favourable for recording clear thermal signals at Halos.

At the same time, a systematic approach of this sort is also labour and data intensive. In the summer, nights are already short, but when you go flying about with a drone, they become challengingly short. And when not out in the field, we do administration work – keeping records for each and every flight, diaries of different sorts, and storing and (if possible) processing images.

Bad Weather

The preliminary processing of images is quite important, as we discovered last November. Having arrived to Greece after days of pouring rain, the clay-rich soil was completely saturated. With a limited diurnal temperature flux (between 10 – 14° C.) and no direct sunlight during the day, we soon discovered that the thermal imagery recorded on our first evening flights did not contain sufficiently distinctive information to enable proper photogrammetric processing. This forced us to adapt our strategy, but for the better. We decided to take high-altitude thermal overview photos, while focusing on specific test sites.

Multispectral Imaging

Luckily, we had other possibilities as well. Another sensor we use is a multispectral camera. More commonly used in agriculture, this camera captures images at different wavelengths of light, thereby enabling the visualisation of differences in vegetation, crop health and soil humidity. Think of the fact that subsurface archaeological features might impede or stimulate plant growth, or could prove favourable for certain plant species at the cost of others. The resulting patterns, known as crop marks, have long been studied through traditional aerial photography. Multispectral images are not only complementary to what can be observed in normal images, but provide a much more specific, diverse and detailed image. Paired with thermal imaging, this is already proving its worth as an effective prospection method (Agudo et al. 2018; Sagaldo Carmona et al. 2020).

In addition to a detailed 3D optical model of the whole Voulokaliva site, produced in November as well, the datasets we collected offer detailed remote sensing data of this extensive funerary site. One additional week of fieldwork is planned for early April, after which we can fully compare and analyse the different visualisations. So, to be continued.


A satellite image of the Almyros plain and the southern end of the Pagasitic gulf, showing our research area
A thermal image of us in the field

Credits

This project is part of the Halos Archaeological Project, which is a cooperation between the Universities of Amsterdam, Groningen and Thessaly, and the Ephorate of Antiquities of Magnesia. It is undertaken as part of the study towards the final publication of the 1990–2006 field survey. We thank dr. Vaso Rondiri, professor Reinder Reinders, and professor Vladimir Stissi for their kind support. The project was made possible through a grant from the Stichting Nederlands Museum voor Antropologie en Praehistorie (SNMAP), the support of professor Stissi/Amsterdam Center for Ancient Studies and Archaeology, the 4D Research Lab and the Stichting Thessalika Erga. Fieldwork is carried out by Elon Heymans, Jitte Waagen and Mikko Kriek.


A screenshot of photogrammetric processing software, showing the drone positions of captured imagery, and the 3D textured mesh of the Voulokaliva area
Left: an orthomosaic of test site A, showing an elongated stone heap on tumulus site 22; centre: a DEM of test site A clearly showing a large tumulus (site 22) and a smaller elevation (site 39) directly to its east – both based on optical images taken in November 2021; right: an NDVI (normalized differentiated vegetation index) image based on multispectral data, recorded in July 2021, also showing sites 22 and 39

References

Agudo, P., Pajas, J., Pérez-Cabello, F., Redón, J., and Lebrón, B. 2018. ‘The Potential of Drones and Sensors to Enhance Detection of Archaeological Cropmarks: A Comparative Study Between Multi-Spectral and Thermal Imagery.’ in Drones, 2(3), 29.

Casana et al., 2017, Archaeological Aerial Thermography in Theory and Practice, Advances in Archaeological Practice 5 (4) 310-329.

Lagia, A., Papathanasiou, A., Malakasioti, Z., and Tsiouka, F. 2013. ‘Cremations of the Early Iron Age from Mound 36 at Voulokalyva (ancient Halos) in Thessaly: a bioarchaeological appraisal,’ in Lochner, M., and Ruppenstein, F. (eds.) Cremation burials in the region between the Middle Danube and the Aegean, 1300–750 BC. Proceedings of the international symposium held at the Austrian Academy of Sciences at Vienna, February 11th–12th, 2010. Vienna, 197–219.

Salgado Carmona, J.A., Quirós, E., Mayoral, V., and Charro, C. 2020. ‘Assessing the potential of multispectral and thermal UAV imagery from archaeological sites. A case study from the Iron Age hillfort of Villasviejas del Tamuja (Cáceres, Spain),’ in Journal of Archaeological Science: Reports 31.

Stissi, V., Kwak, L., and de Winter, J., 2004. Early Iron Age. In: Reinders, R. (Ed.), Prehistoric Sites at the Almiros and Sourpi Plains (Thessaly, Greece). Assen, 94-98.

Waagen, J., 2019. New technology and archaeological practice. Improving the primary archaeological recording process in excavation by means of UAS photogrammetry. Journal of Archaeological Science, 101, 11-20.


The challenge of digitally reconstructing colour and gloss: the UNESCO Pressroom case study

Project background

How can virtual visualisation support decision-making in the restoration of historical interiors? In 2018, conservator in training of historic interiors Santje Pander, won the '4D Research Lab' launch award for her project on the UNESCO Press Room, by the renown Dutch architect and furniture maker Gerrit Rietveld. The room was designed for the UNESCO headquarters in Paris in 1958, but had become redundant and old-fashioned by the 1980s, after which it was dismantled and shipped back to the Netherlands for safekeeping by the Cultural Heritage Agency of the Netherlands (RCE). In recent years, the room has been brought back into attention, and was revaluated, which led to ideas about its possible reconstruction (recently a space has been found for the interior by the RCE).

For her MA thesis, Santje studied the possibilities of reconstructing specifically the linoleum surfaces of the room, which were designed as a unique pattern of shapes and colour that covered both floor and furniture. She proposes various alternatives for the reconstruction of the floor. The main choice regards the reconstruction of the linoleum floor using linoleum from the current FORBO (the original manufacturer) collection, or using a newly produced reconstruction of the old linoleum. For the latter option, two alternatives were proposed: reconstruct the linoleum to match the aged and faded colours of the furniture, or reconstruct the linoleum 'as new', based on samples found in the FORBO archives. An important consideration is whether the reconstruction respects the original intensions of Rietveld, who designed the floor and furniture (and in fact the entire interior) as a unity. The concept of unity was especially important since the architecture of the room itself impeded a sense of unity due to its irregular shape, and awkward positioning of structural colums.

The digital 3D reconstruction of room and furniture

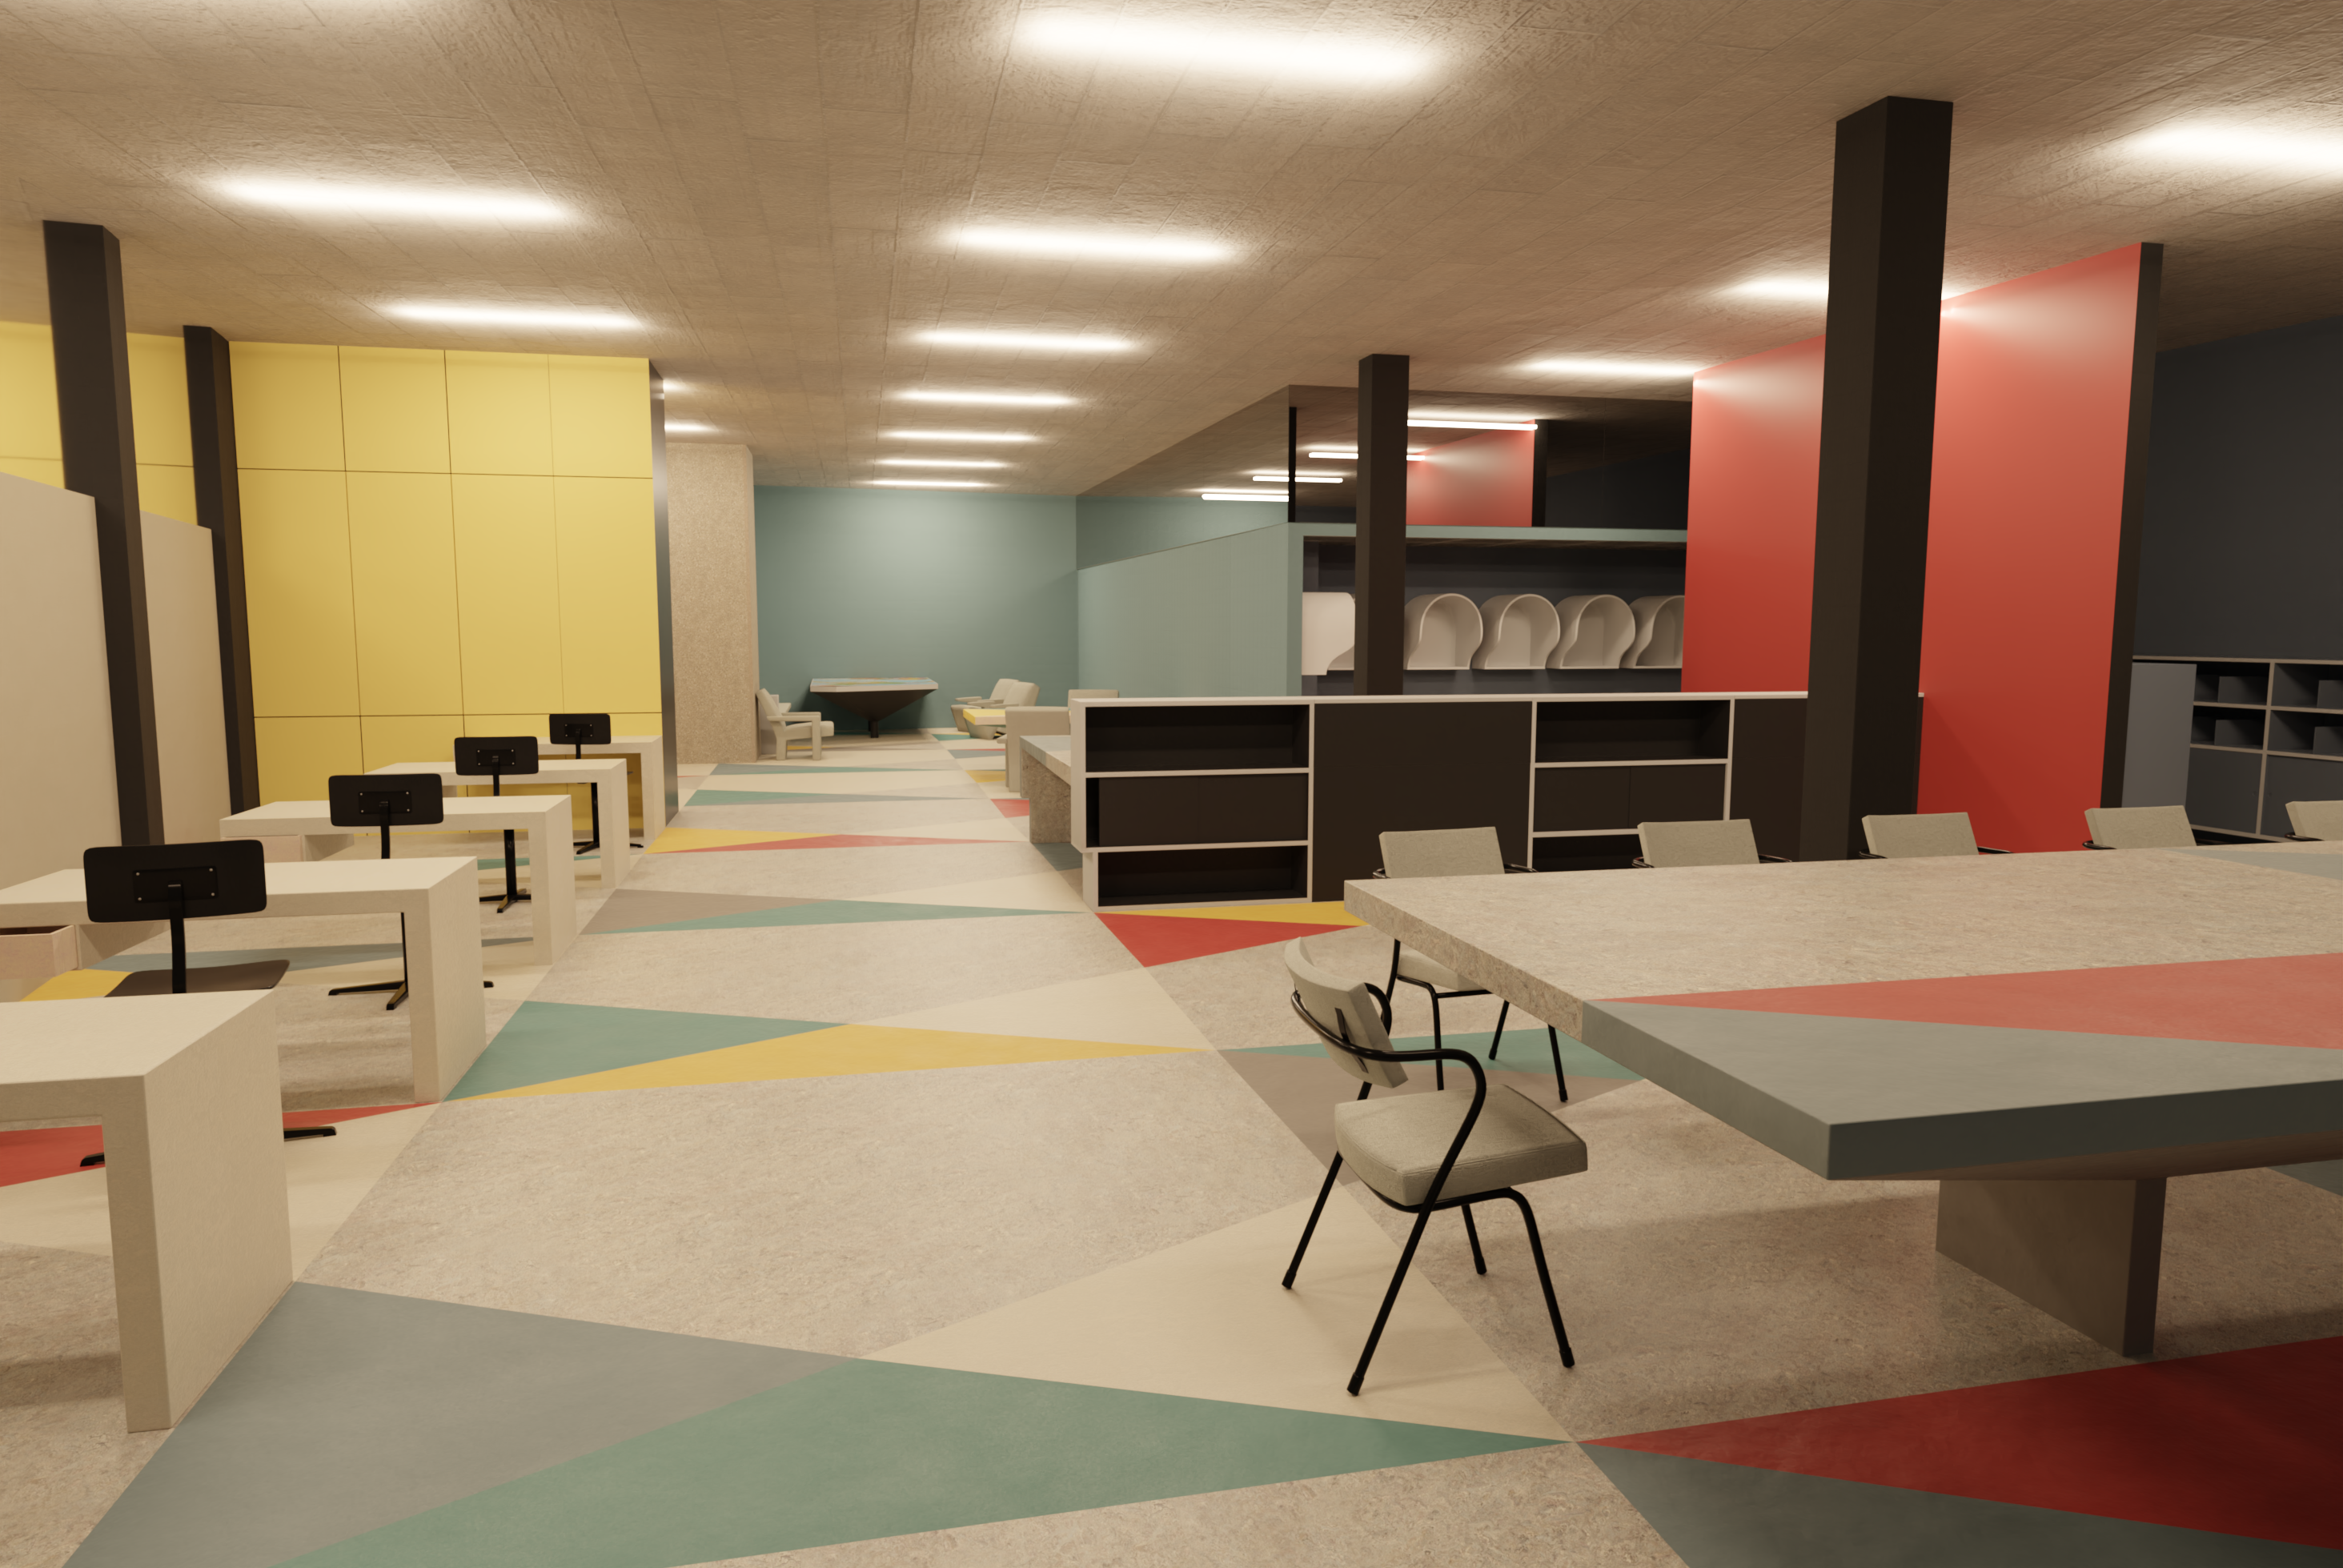
Although Santje's main focus was on the elements covered with linoleum, it was clear from the start that in order to to gauge the effect of certain choices on the perception of the room, the entire space had to be digitally reconstructed. This included features such as walls covered in different vinyls, wooden painted cabinets of various types, mirrors, windows, furniture with vinyl upholstry, concrete architectural elements, and of course the TL-lighting. A unique object was the so-called 'world-map table', a table with a light box type tabletop, which featured a map of the world. Fortunately, the original design drawings were preserved, as well as many (but not all) of the original objects. During modelling, the designs were compared with the photographic evidence and the preserved pieces in the depot, which reveiled only small divergences between design and execution. Hence, certain details aside, the reconstruction of shape and dimensions is generally of a high degree of certainty. As an added benefit of the modelling process, we gained some insights regarding certain design decisions by Rietveld, which we discuss in more detail in the project report.

Work in progress. Integrating the original paper designs with the model.

Reconstructing colour and gloss

For the reconstruction of the colours, we used colour measurements that Santje performed on the original linoleum samples and cleaned surfaces of the original furniture. The colour measurements were originally done with a X-rite Minolta i7 spectrophotometer, but we noticed that these diverged from the colours as measured on photographed samples, even though the light conditions of the spectrophotometer were matched by the studiolights. So we used both, to see if there was a noticeable effect on the reconstruction.

In restoration science, much attention is paid to accurate recovery of material properties such as colour and gloss of a surface. Subtle differences may detract from the experience of the authenticity of an object. However, accurate digital reproduction of these properties is not an easy task. The scientific approach would be to objectively measure colour and gloss, and then to enter these values into the 3D modelling program. This is not as simple as it seems. Colour is nothing more than certain wavelengths of light being interpreted by our brain, which 'colour-codes' it for us on the fly. This helps us to distinguish different kinds of objects. Colour perception varies across our species, so it is is very hard to objectively define colour. Also, colour is dependent on light: the same object has a different colour or tint under different environmental lighting conditions. So when we 'measure' colour, we basically measure a surface under specific conditions. Usually, this is 'daylight', which is a soft whitish light that we arbitrarily define as 'neutral'. However, in 3D modelling programs you create another virtual environment with lamps with specific properties, which means that the surface with the measured colour value is lit again, but under different conditions (in the case of the Pressroom: TL-lighting), creating yet another colour. And it becomes even more complex, since we also have to deal with the fact that there exists no single system to store and represent colour ('colour spaces'), and the digital model we use on devices (RGB) is a strong simplification of our own perception. Long story short, to match the colour and appearance of an object in a 3D program with simulated lights is ultimately a subjective process of trial and error.

Gloss on the other hand is basically the result of the microscopic roughness or bumpiness of a surface. The rougher a surface is, the more light gets dispersed, the more matt a surface appears. The smoother it is, the more it reflects light back to the observer. The smoothest surfaces are mirrors. There are devices that measure gloss, which was used by Santje in her material study. However, the resulting values cannot be simply entered in the 3D program we used (Blender), since it uses an entirely different model for computing gloss. So our method was to closely observe the original linoleum samples and linoleum floors in the real world, and try to match this in the 3D modelling program.

Historical linoleum samples on top of a modern linoleum floor. Photo by Santje Pander.
The effect of using a different colour measurement method. Left: RGB measurement on photos. Right: photospectometric measurement.
Photo of the Pressroom by UNESCO/D. Berretty.

Rendering

We created multiple renders with different material settings from the same perspective in order to compare the effects on the perception of the room. On purpose we chose a viewpoint that matched one of the historical photographs, so it was possible to compare this directly to the digital reconstruction. As the 1958 colour photos have known issues regarding the representation of colour, the marked difference was an interesting result that calls for reflection on how accurate our reconstruction is and how faded colour photos can cause a wrong impression of the original room.

The perceptual difference between the room in which modern alternatives of the colours are applied and those in which original colours are applied is especially striking. The difference between the images which show variations of the original colours ('as new', and 'aged'), is less perceivable. Although the actual RGB values are notably different when viewed next to each other in isolation, if applied in the room itself, differences are only noted after very close examination. It may be that the multitude of visual stimuli in the entire picture make it very hard for our brains to perceive small differences.

Render of the Pressroom from the same perspective as the photo. Colours based on colour measurement on original linoleum samples.

Reliability

The question remains whether these results are reliable enough to be used in the restoration decision-making process. There are multiple factors of uncertainty, the method of digital colour and gloss reproduction being an important one. Another factor is that we do not exactly know the original light conditions inside the room. We know that TL-lamps were used, but not exactly their power and light temperature. Based on these uncertainties, it can be argued that it is questionable that we have accurately recreated the interior. The model should therefore be considered as such, a working hypothesis about the physical appearance of a lost space. But we must not forget that an authentic recreation has in this case never been the aim. Moreover, it is quite unlikely that modifying the uncertain variables within reasonable bounds would have changed the outcome of the study significantly. Nevertheless, to model colour and lighting more accurately based on real world measurements, the digital methods we use also must improve.

Render of the Pressroom using colours available in the current FORBO collection, with a modern, glossy coating.

A virtual visit

The project got a nice spinoff in the form of an online 3D tour through the room, made in collaboration with the RCE. For this application we expanded the model to complete the room, and it was integrated with stories about the room from a design perspective. Of course, for this application we can only show one of the versions that we recreated. As a side note in respect to the above, the modifications and conversions necessary to be able to render the model in the browser create again a slightly different version of the room. This underlines the importance for us, researchers in the humanities, to understand and be transparent about the technical procedures and cognitive processes that lead to the creation of such digital 3D representations.


Screen capture of the virtual tour

Principles and standards

We finally got around writing up the 4D Research Lab approach on 3D visualisation. For the use of virtual reconstruction in the context of academic research, it is paramount to have a clear conception on both the modeling process as well as the final result, and communicate this as well as possible. Thorough research, responsibility, transparency and verification are key-concepts here. For the 4D Research Lab principles and standards, this amounts to:

  • A principle statement, in which we define the role of 3D visualisation in academia, our views on academic rigour, accessibility and sustainability. As for academic rigour, we build forth on “The London Charter for the computer-based visualization of cultural heritage” and the “Principles of Seville, international principles of virtual archaeology”.
  • A template, which is the application of the principle statement into a standard format for execution and documentation of 3D visualisation projects, and compiling reports.
  • A definition of our take on dealing with (un)certainty in 3D visualisation, accompanied with a 6 degree classification of certainty levels.

These standards and principles will be applied to all projects of the 4D Research Lab to ensure uniformity but also to create a database to be able to compare their performance. Surely, in due course we will find that we might improve on our project template or classification of (un)certainty. We do not consider them written in stone, but as a culmination of our experience so far, and they will surely be susceptible to future evolution into better versions of themselves.

Certainty Class

Variability

Indication


Example

Colour

Certain

None

Empirical

Scanned remains

89a5c1

Quite certain

Low

Logical extension

Missing part of relatively complete
object

95bf8f

Moderately certain

Limited

Close parallel

Same type, direct relation

eee3ab

Not so certain

Considerable

General parallel

Same type, indirect relation

d9cfc1

Quite uncertain

High

Historic context

General stylistic traditions

a77e58

Very uncertain

Very high

Theoretical

Constructional argument

ba3f1d

The tower that never was… until now

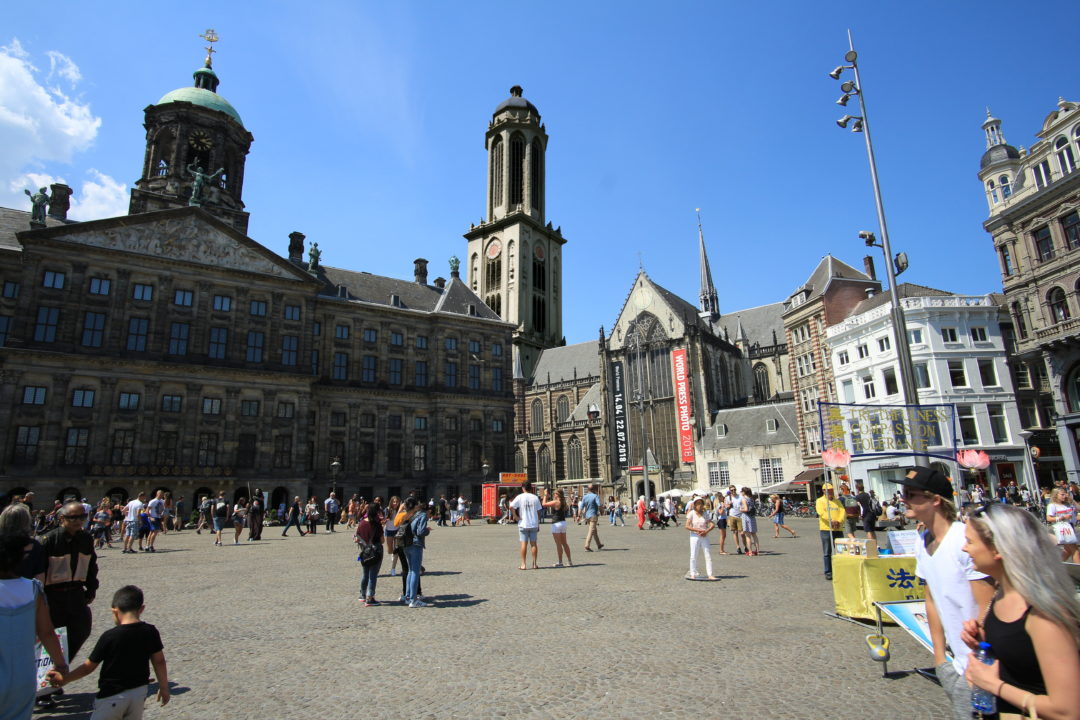
In spring this year, celebrating the launch of the lab, we had a call for small research projects making use of our services. Of course we chose one winner, but these projects were all so interesting that we decided to award all a small pilot study of their project. One of these was Gabri van Tussenbroeks project on the ‘Nieuwe Kerktoren’, the tower of the New Church at the Dam in Amsterdam.

I hear you wondering, “what tower?”, and that is exactly the issue at stake. That tower was never build. This is a fascinating history and Gabri van Tussenbroek dedicated his most recent book, “The toren van de Gouden eeuw”, to the complex of political, social and financial reasons for this stalled construction project. It was very well received, and shortlisted for the Libris Geschiedenis Price 2018. (video)

In the 17th century commentators worried that this 116 m high tower might overshadow the recently constructed new world wonder, the Amsterdam City Hall. It begs the question, what would the urban impact have been on the city centre of Amsterdam if this tower was build after all? With this question Gabri van Tussenbroek came to us.

Continue reading “The tower that never was… until now”