The Bonnefanten Museum in Maastricht houses the largest ensemble of Hortisculptures by the Dutch artist Ferdi (1927-1969). These colourful and eclectic sculptures have unfortunately experienced damage over time and are undergoing restoration by independent conservators, both at the Bonnefanten and at a studio in Amsterdam.
Aims
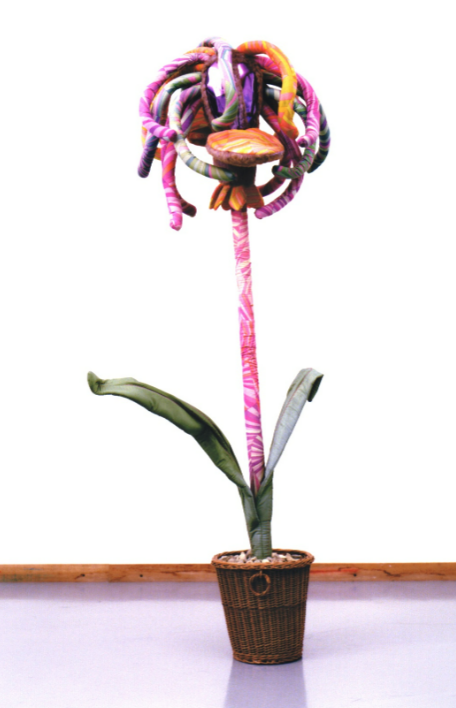
One such sculpture, the Shigiory Torinata, is a tall flower made from silk and artificial fur. It has tentacle like petals, a long stem, and rests in a wicker basket with leaves protruding out of it. The stem shows the majority of the damage, with tears in the fabric and along the seamline, as well as discoloration due to sun damage. In order to conserve this piece, the tears have to be sown and the discolouration restored.
For these reasons, the Shigiory Torinata has been chosen to be restored with the help of 3D methods at the 4D Research Lab. Due to the stem's altered material, the pattern needs to be first documented in 3D, then virtually reconstructed, and finally printed onto new fabric that can be sown back onto the sculpture - without removing or modifying the original fabric.
Documentation
In order to document the stem's intricate pattern, the Artec3D Leo was used to scan the geometry with the texture. This handheld, structured light scanner offers a fast and high-resolution result.
Fortunately, the colour patterns displayed on the stem coincide with the patterns on the petals, which have experienced less light damage. These preserved colours allow us to replicate the pattern from the stem. After 3D scanning, colour measurements were taken of these petals using the Nikon D5300 camera, ring flash AR400, and a double polarised lens.
Digital Restoration
The next step after documenting the stem is to UV unwrap the pattern on Blender. However, since the fabric on the sculpture has wrinkled and bunched up in areas over time, it does not virtually unwrap flat. This causes distortion in the pattern, which has to be taken into account while reconstructing it digitally.
A 3D cylinder was created and aligned with the original stem and seam lines were assigned to it so that when the texture is projected onto this reconstructed cylinder, it can be unwrapped along those lines. This results in a flattened rectangular projection of the fabric.
The projection was transferred into Inkscape, an open source graphics editor. There the pattern was traced using curved line tools. Images from the tentacles with preserved colours were transferred into this workspace, and using the eyedropper tool, the correct colour was identified from each pattern. Colour swatches were created and these served the basis for reconstructing the colours of the stem. Twelve colours were identified in total, which will be verified in accuracy by the conservators working with these Hortisculptures.
Results
Once the pattern has been reconstructed, we brought it back into Blender and reapplied to its cylindrical stem by baking the pattern onto the original fabric and applying a silk texture map. In this way, we can visualise how the stem will look with its vibrant colours restored once the fabric is printed.
Credits:
Bonnefanten Museum
Charlotte Franzen, Head of Collections
Paula van den Bosch, Senior curator contemporary art
4D Research Lab
Tijm Lanjouw, Senior 3D Modeller
Alicia Walsh, Junior 3D Modeller
Conservation and Restoration
Ellen Jansen, University of Amsterdam, Independent conservator
Kaltja van de Braak, Independent conservator
Shinkichi Tajiri Estate
Shigiory Torbinata, 1966, Photo by Peter Cox,
credits: Bonnefanten Museum
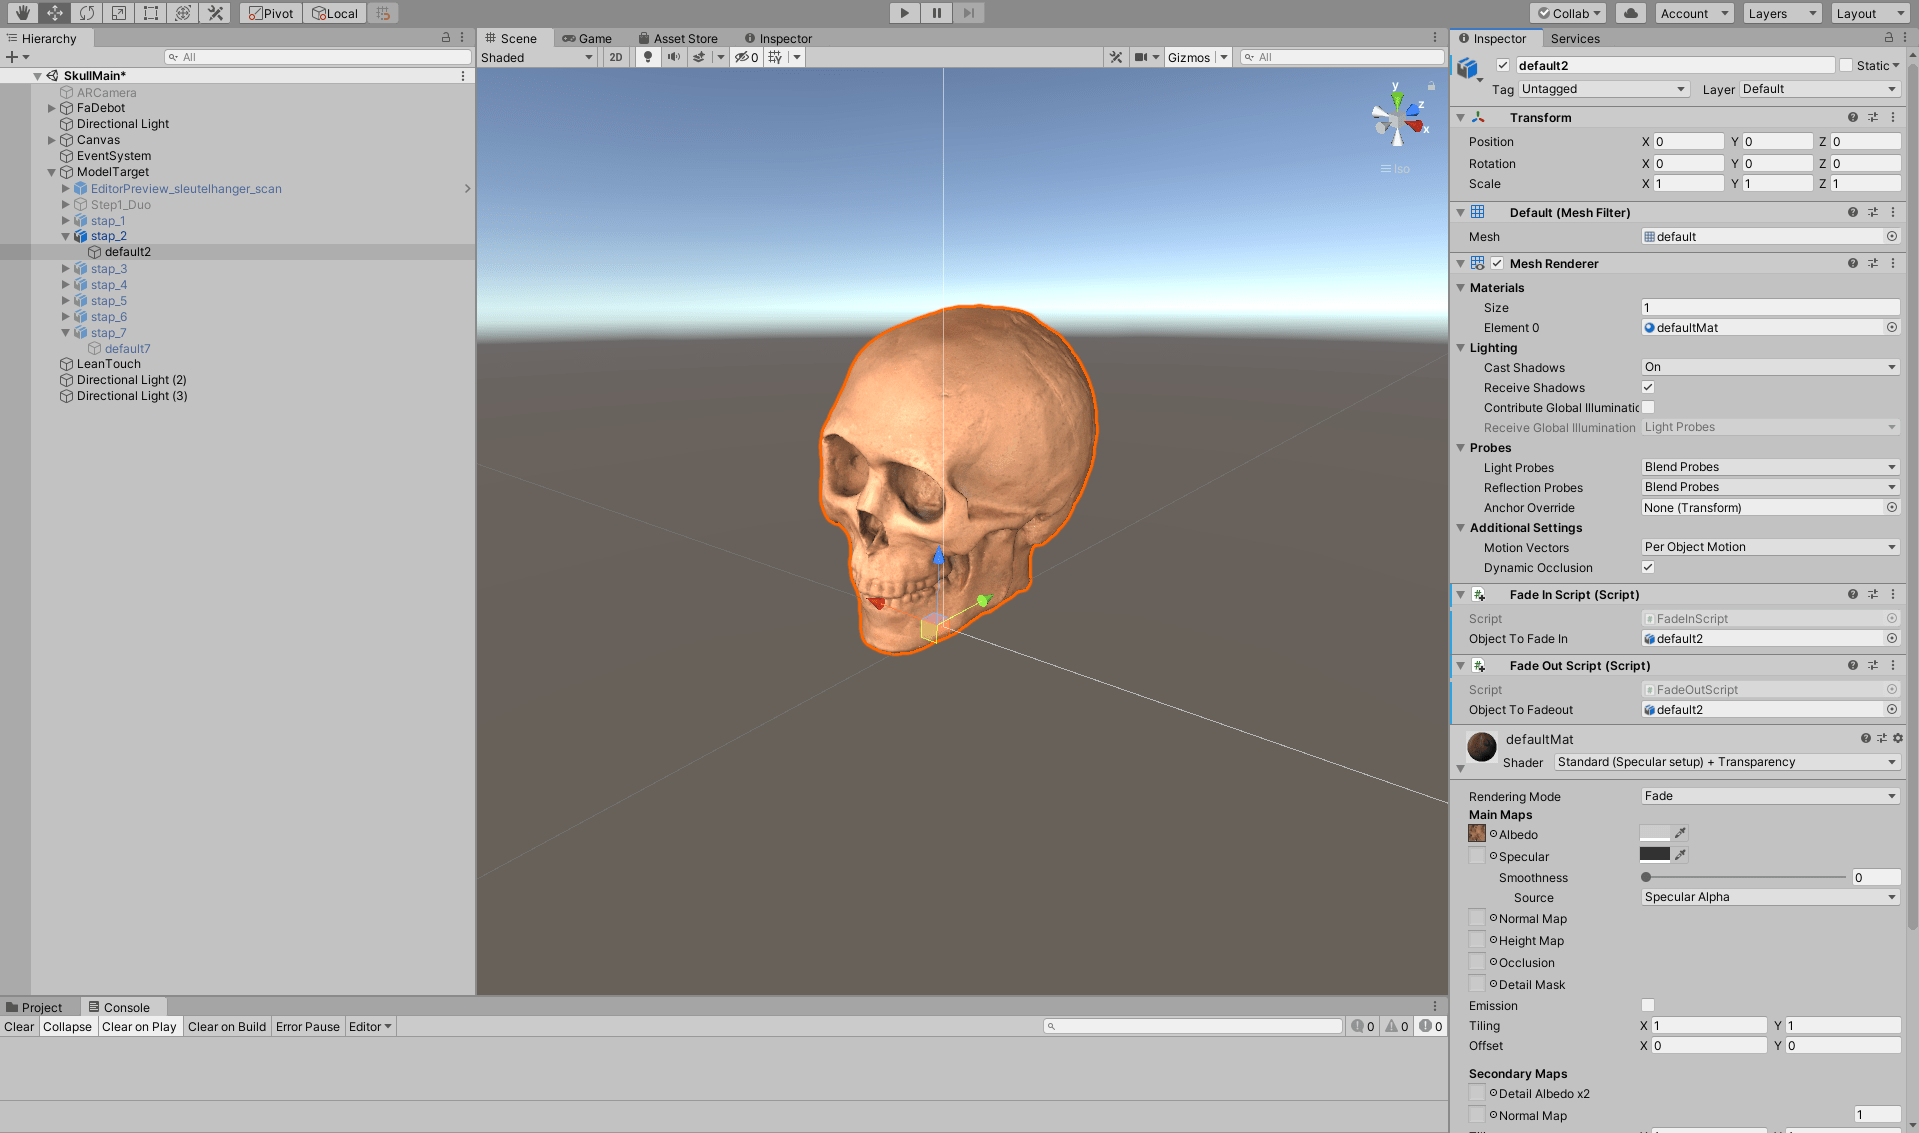
The Allard Pierson, where the collections of the University of Amsterdam are housed, owns a group of animal mummies from ancient Egypt. They had never been studied in detail, so a research project was initiated in the summer of 2021 to answer the question of what is exactly inside the mummy wrappings. In the first step of the project, the mummies were taken to the Amsterdam University Medical Centre (UMC) where they were run through a CT scanner. This resulted in high-resolution image data of the interior of the mummies, that allowed to specialists to identify the animal species and study the bones, wrapping and any items that may have been included during the process of mummification. Over the last four months of 2021 we have been working on a 3D viewer that allows museum visitors to interact with the scan data themselves. This project is still in progress, but a prototype was quickly developed and was on display in the exhibition Dierenmummies Doorgelicht ('animal mummies exposed') from 11 december 2021 until the Netherlands went back in lockdown at the end of 2021. In this blogpost I’ll discuss the process of creation so far, and include some tips for anyone looking to visualise volumetric data such as CT scans, in a 3D web viewer.
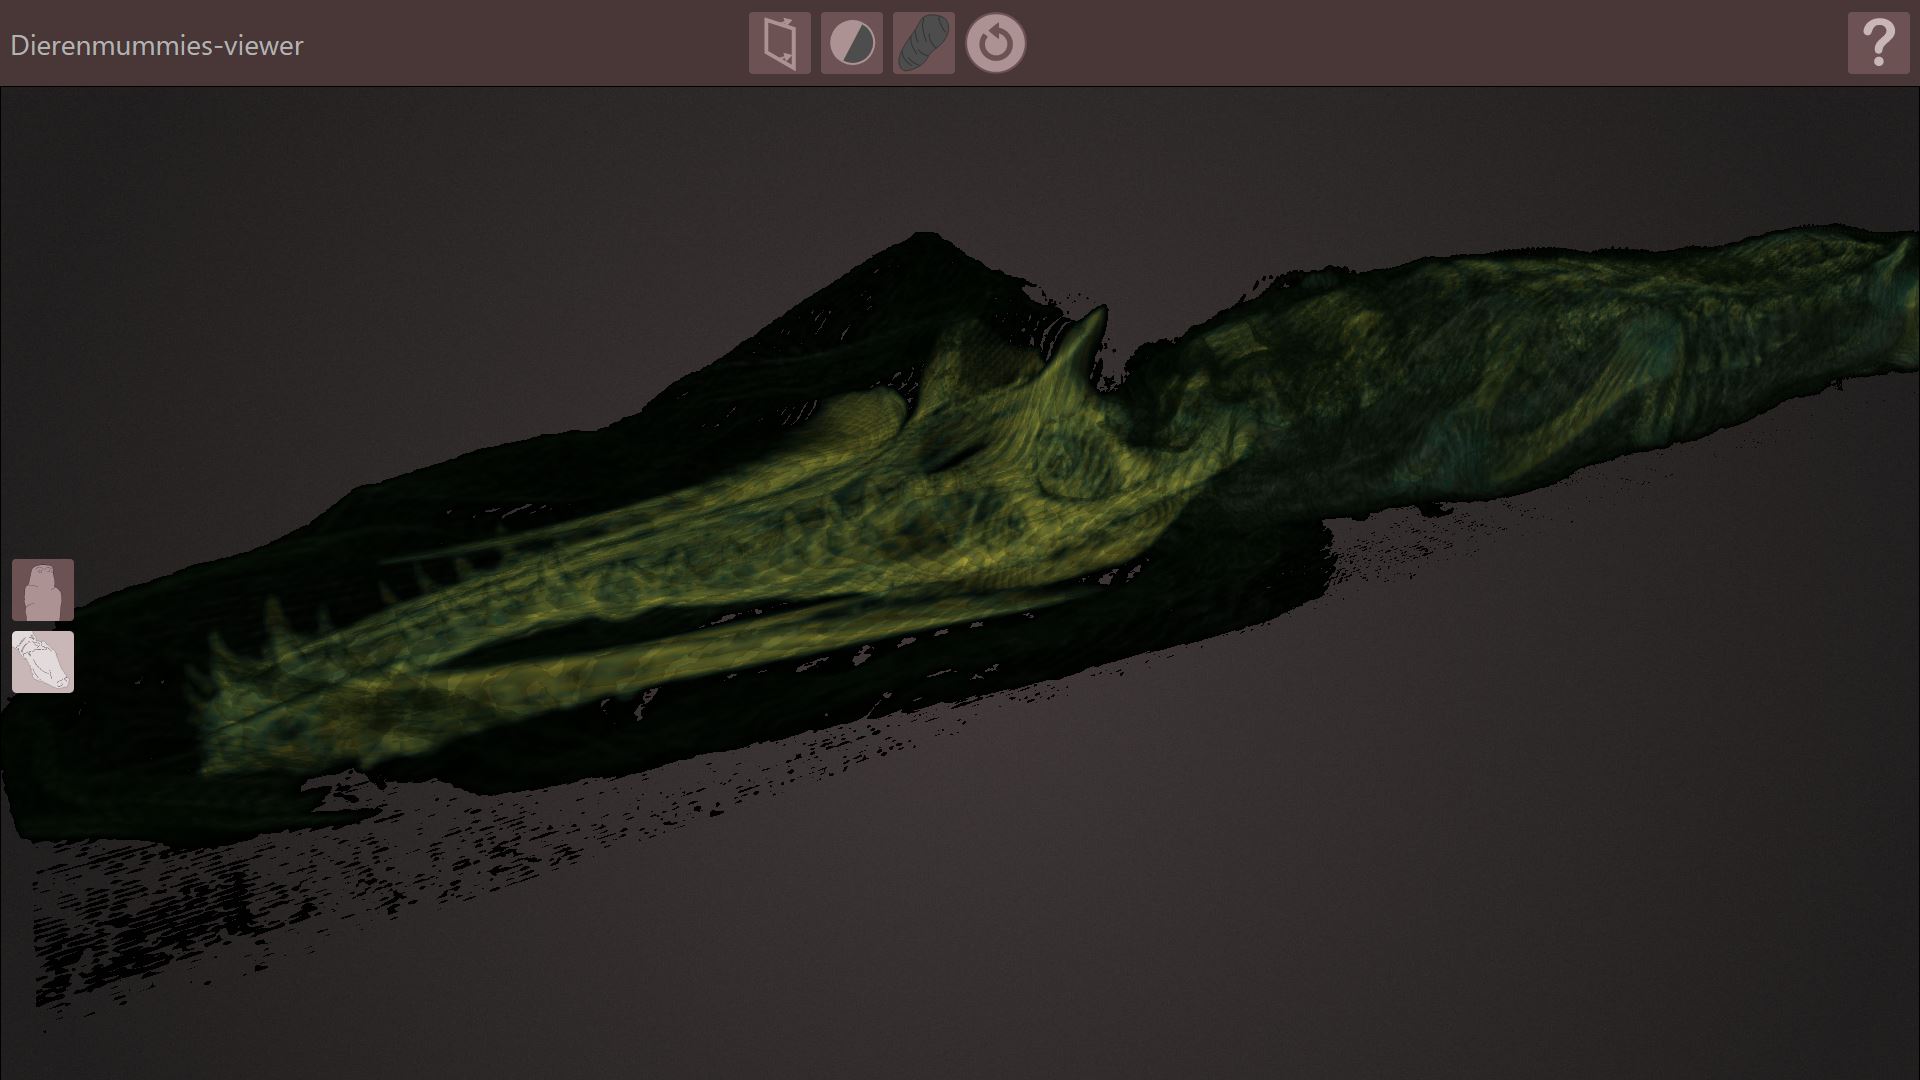
Volumetric display of crocodile mummy with cross-section tool active in the pilot version.
The idea
The idea of displaying the interior of mummies in a digital application that allows visitors to unpack them layer by layer is not new. A company named Interprectral has made name in the museum world with applications comprising beautiful visualisations and intuitive user interaction on touchscreens. In the Netherlands, they have worked with the National Museum of Antiquities in Leiden, who also had their animal mummies CT scanned recently. It is needless to say that we were inspired by their work. Although Interpectral offers their software for sale, we as a university lab are interested to learn how to create such an application ourselves with the use of available open-source tools. We also wanted to add an extra feature not seen in the application offered by Interpectral: we wanted to give the user not just the possibility to unwrap the mummy layer by layer, but also allow them to interact with the CT scan data and study them in a manner akin to how professionals are doing. In the same vein, we wanted people to be able to snapshot and annotate their discoveries, and send them to the museum.
The pilot
For the pilot that was developed for the temporary exhibition we did not intend to include all the features from the conceptual design. We wanted to get acquainted with the technology and the workflow, and to create a basic application. In the prototype thus created users can switch between exterior and interior viewing mode, create cross-sections of the data and adjust the display of CT scan data density. The annotation, snapshot and send tools must still be developed. Within the time constraints, we could not create models for all animal mummies , but choose two iconic specimens: the crocodile mummy (APM17925), and a bird mummy (APM16999).
Credits
Allard Pierson
Ben van den Bercken - curator Ancient Egyptian collection
Martine Kilburn - exhibition project manager
4D Research Lab
Jitte Waagen - coordination
Tijm Lanjouw - development, modeling, design
Markus Stoffer - development
Amsterdam UMC
Mario Maas - professor radiology
Nick Lobé - radiology lab technician
Roel Jansen - radiology lab technician
Zosja Stenchlak - radiology lab technician
Volumetric display of CT-scan data of the crocodile mummy with high density materials isolated with the density slider tool.
3D Viewer choices
The first choice that had to be made is whether we wanted to use a game-engine like unity or unreal or a web-based framework to create the application in. We went for the second option as a quick review showed us some usable examples, and with an eye on future use of the technology we prefer to use browser-based applications as it makes sharing 3D models resulting from our projects more easy.
In fact, there exist already many solutions for online viewing of medical data resulting from MRI, CT or other types of scanners, many of which are open-source. This showed us the potential. However, since we wanted a completely custom user-interface and not only to display CT scan data but also regular 3D mesh models and high-resolution textures of the exterior, we needed a more general approach. A code library with an application programming interface (API) gives us this flexibility. For 3D display there are several widely used libraries, but not all have many options when it regards displaying volumetric 3D data. In the end we settled for X3DOM, a viewer developed to display all kinds of (scientific) 3D data and which showed some promise with regards to volumetric 3D. The website contained an example that already did most of what we wanted with regards to allowing the user to make cross-sections and modifying density. We could take it easily from there, so we thought.
Data processing
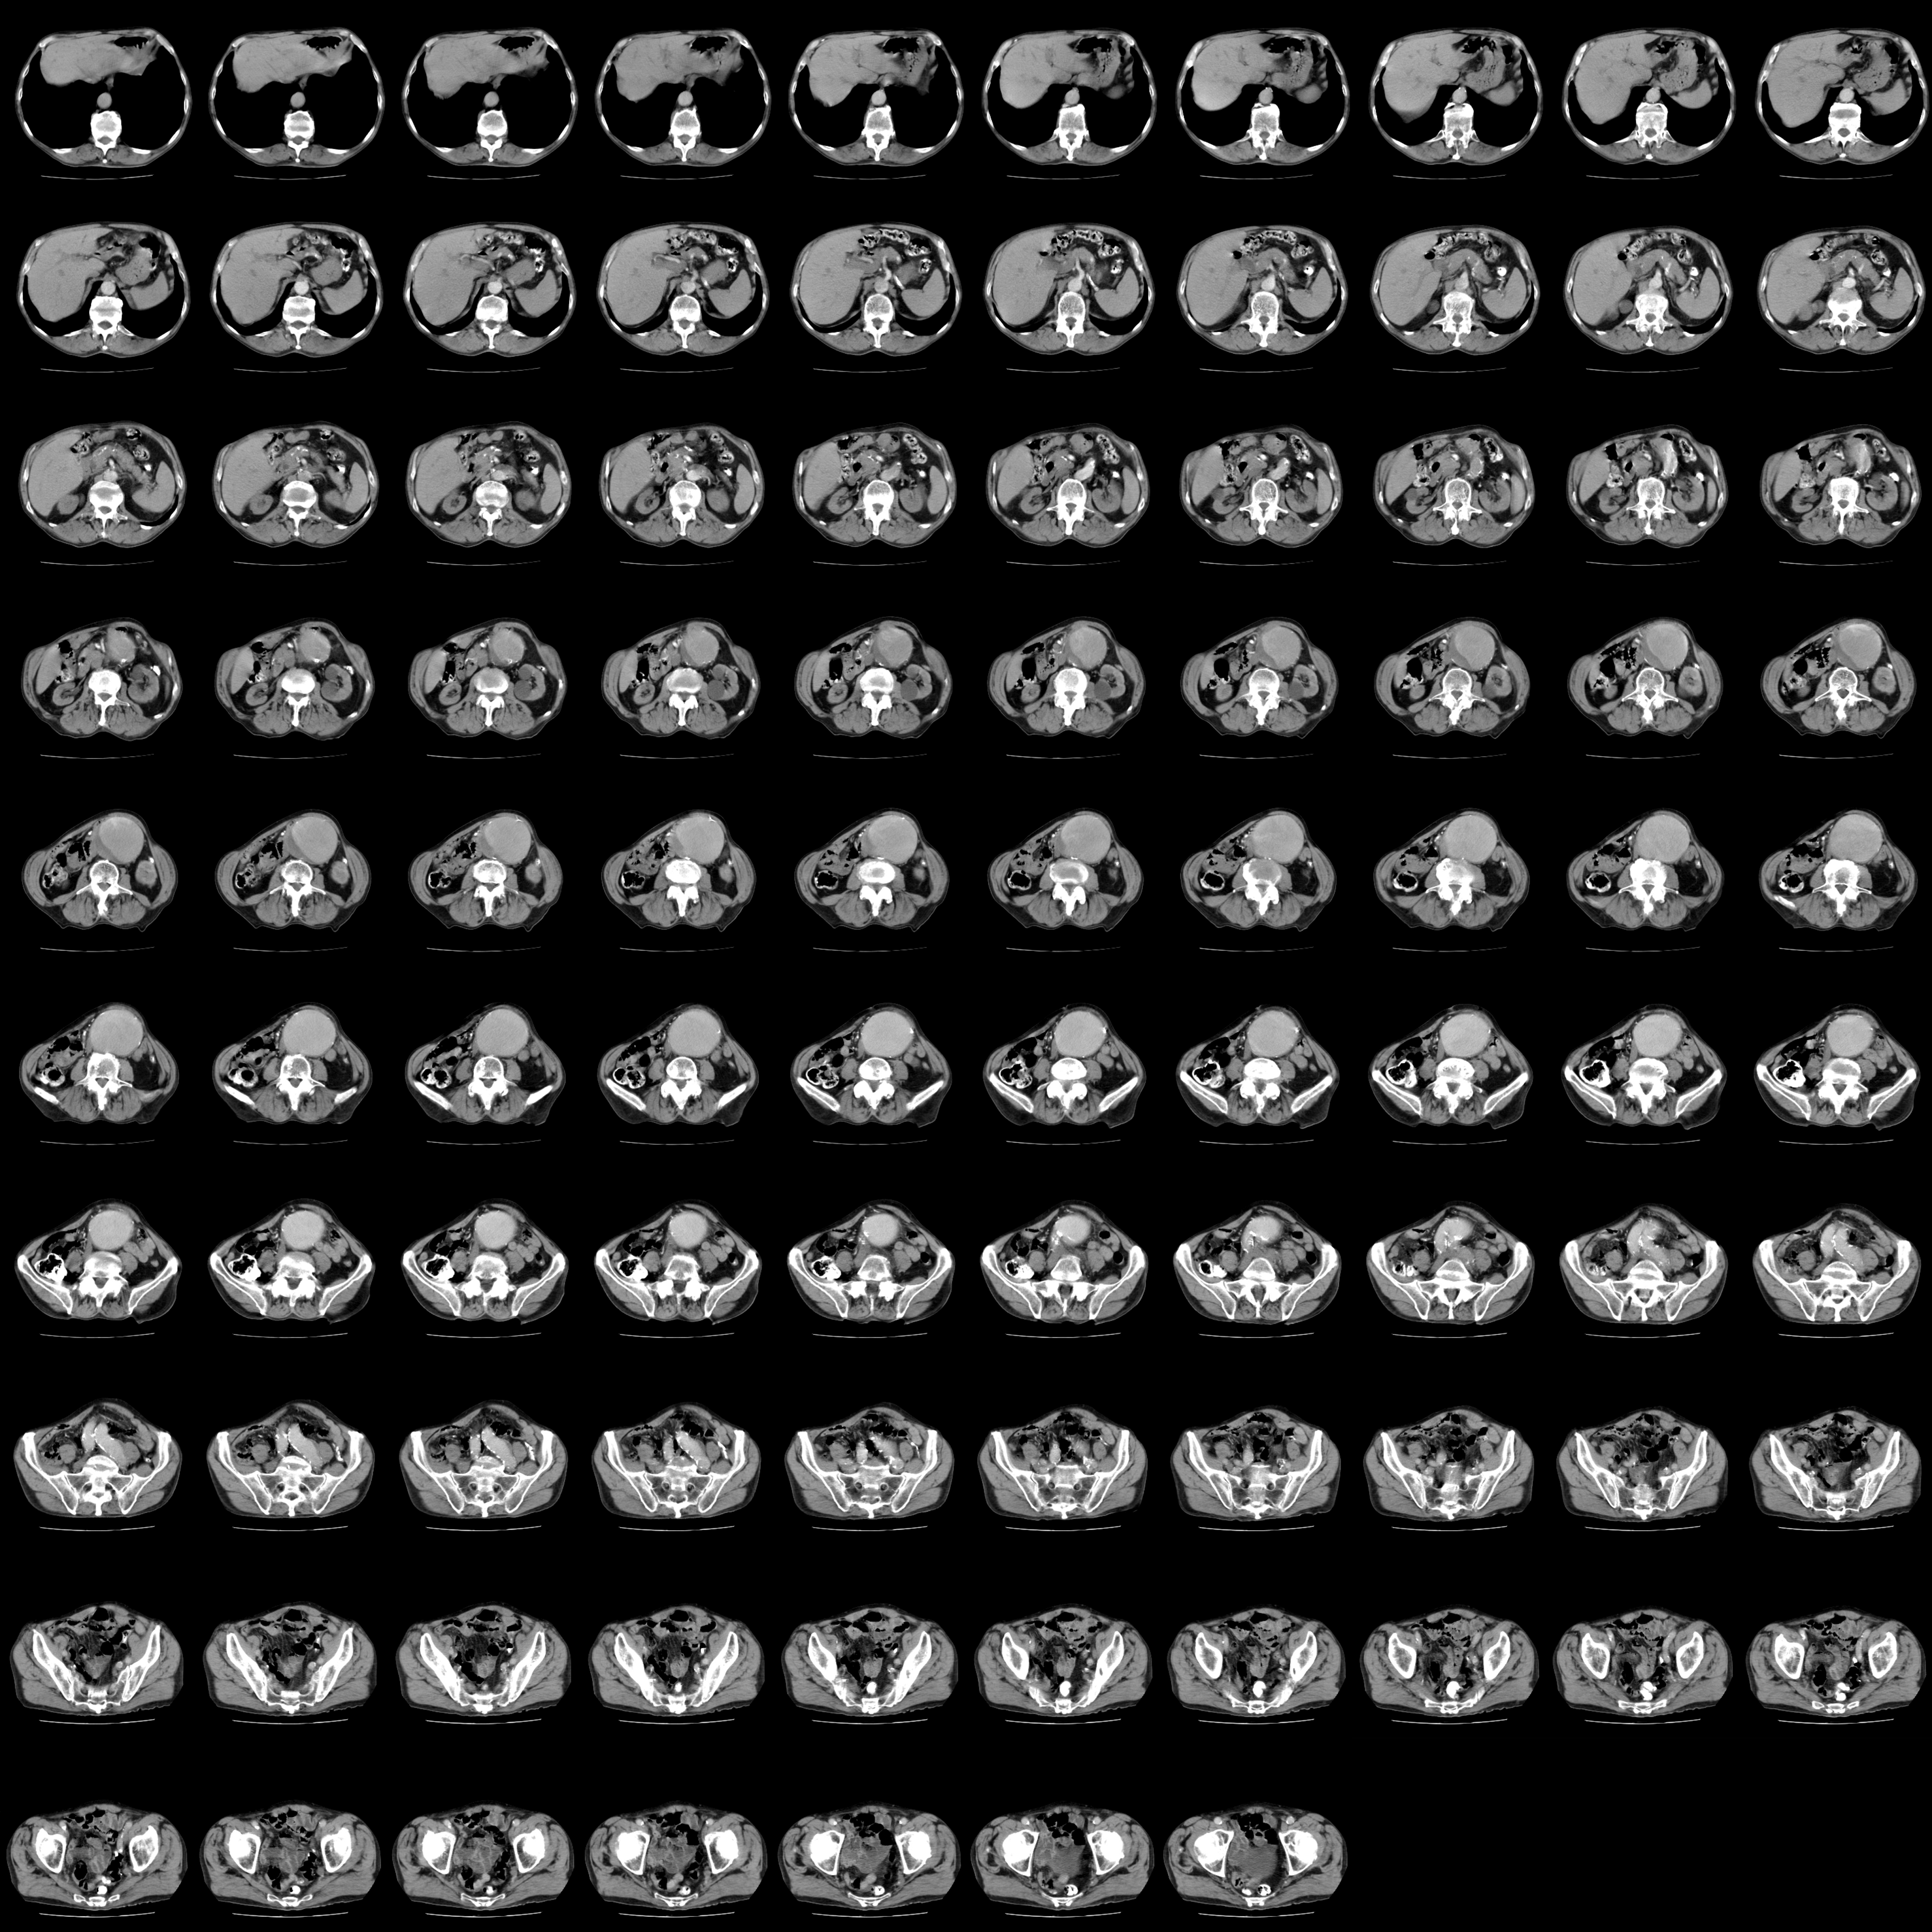
When working with CT data, it is important to understand what CT scanners actually do and what kind of data they output. CT scanners make X-rays from multiple sides of an object, and uses computer algorithms to create ‘slices’ (cross-sections) of an object on predetermined distances. The slices can be in the order of 200 μm (= 0.2 mm) apart, so it creates very high-resolution data. Each slice is an image with a fixed resolution, such as 512x512 pixels. CT scan datasets are thus series of 2D images positioned in a 3D space. Unlike regular digital images, the pixel values do not represent colour values (e.g. RGB), but Hounsefield values, which is used for material density. The CT scan allows us therefore to discriminate materials with different densities: bone from fabric or metal. This makes it a very powerful analytical tool for material studies.
The raw data was delivered to us by the Amsterdam UMC as DICOM files, which fortunately is a global standard for medical data that is readable by many applications. For processing we used the open-source package 3D slicer, which is a very powerful piece of software created to process and visualise medical 2D and 3D data. I highly recommend it. First, parts of the CT scan data we did not want to show had to be cut off – for instance the support the mummy was placed on during the scan. Second, it had to be reduced in resolution for fast loading in the app. Third, the images with Hounsefield values had to be converted to regular RGB. We only became aware of this requirement during the process. Unfortunately, this means an immense compression of data as one RGB channel can only take 255 values, while the hounsefield scale runs from -1000 (air) to +30.000 (metals).
The processed data was exported to NRRD format, which is another universal standard used to exchange medical imaging data. With a piece of custom code extension written by the X3DOM community, NRRD data is directly loadable in the 3D viewer and displayed as a volume. Without this code extension, it is required to create texture atlases of the CT-scan data, that combine the individual slices in one very large image. This is the default functionality of X3DOM that we didn’t use.
3D slicer is excellent open-source software with much training material available and an active community of users.
Animated CT scan slices and volumetric reconstruction of the bones.
Scanning the exteriors
The CT scans can be used to create very high-resolution 3D models, but they do not contain the original colour of a surface. Since we wanted to show the relation between exterior appearance and the interior of a mummy, we needed to make separate 3D colour scans of the exterior. The scans were made on location in the Allard Pierson using photogrammetry and another scan with our latest acquisition: the Artec LEO. The LEO is a mobile 3D scanner using structured light technology and we wanted to test this scanner on these objects and compare it with the photogrammetric scans. It is very fast and flexible (no wires attached), but both in terms of texture quality and 3D mesh resolution does not match the quality of photogrammetric 3D reconstruction. We reduced the photogrammetric mesh models to 200.000 faces and created a 4k texture, which resulted in good quality models with ample detail.
Photoscanning the crocodile mummy.
The photoscanned exterior of the crocodile mummy displayed in the animal mummy viewer.
Displaying volume
As said, CT scan data is nothing more than series of cross-sections at different locations in an object. To create a 3D representation, these images are converted and interpolated and displayed as voxels, or volumetric pixels. This works in a web-based viewer like X3DOM no different than in a professional piece of software like 3D slicer. Using a range of rendering techniques, the display quality of the volume can be improved, for instance by modifying opacity and enhancing outlines or by darkening crevasses and lightening protruding areas. However, compared to the quality that is attainable with software like 3D slicer, the rendering of volumes in X3DOM lags behind. This is not just a rendering issue, but also attributable to the reduction in resolution, and the compression of Hounsefield units to just 255 values. Although X3DOM does offer ways to improve volume display, these are not compatible with the NRRD loader that I mentioned above. We may therefore have to reconsider our approach, and avoid using NRRD after all.
Volume rendering comparison. Left: in data visualisation software 3D slicer, right: in X3DOM webviewer.
Integration
The application is basically a single XHTML web page, which loads the models by referencing the external model files. X3DOM is a framework created around the X3D file standard. So the models need to be in X3D format, although recent versions can also handle the more common .gtlf/.glb format. The user interface and interaction is a custom design using html, css and javascript. The X3DOM API allows for easy integration of all the functionality with models and user interface, although quite some time was spent on learning the right way to reference the X3DOM functions and properties. We ran into some complications which are common when working with open source. For instance, pieces of code found on websites like github or in examples online were sometimes not compatible with recent versions of X3DOM, which required the occasional time-consuming deep dive in the source code to fix it. We managed, but it is clear that we sometimes hit our limitations as self-taught programmers with many other interests besides the technology itself.
Animal mummy app prototype in the exhibition room, with touchscreen and projection on wall.
Conclusion
Although we successfully created an application that could count on a lot of positive response during the opening of the exhibition, there are some critical notes to make. This mainly regards the display quality of the CT scan data. As the purpose of display quality is not aesthetic but mainly to create a visualisation that is easily understood and interpreted by the user, this is something we will need to focus on in the upcoming months. We furthermore noted that the touch interaction with the 3D models could be improved, although we are limited by X3DOM functionality in this regards. We will also start adding the other planned features such as the annotation and snapshot tools that allow the user to make independent observations and interpretations about ancient artefacts. Finally, we will keep on adding new mummies until all scanned specimens are accessible through the animal mummies viewer.
How can virtual visualisation support decision-making in the restoration of historical interiors? In 2018, conservator in training of historic interiors Santje Pander, won the '4D Research Lab' launch award for her project on the UNESCO Press Room, by the renown Dutch architect and furniture maker Gerrit Rietveld. The room was designed for the UNESCO headquarters in Paris in 1958, but had become redundant and old-fashioned by the 1980s, after which it was dismantled and shipped back to the Netherlands for safekeeping by the Cultural Heritage Agency of the Netherlands (RCE). In recent years, the room has been brought back into attention, and was revaluated, which led to ideas about its possible reconstruction (recently a space has been found for the interior by the RCE).
For her MA thesis, Santje studied the possibilities of reconstructing specifically the linoleum surfaces of the room, which were designed as a unique pattern of shapes and colour that covered both floor and furniture. She proposes various alternatives for the reconstruction of the floor. The main choice regards the reconstruction of the linoleum floor using linoleum from the current FORBO (the original manufacturer) collection, or using a newly produced reconstruction of the old linoleum. For the latter option, two alternatives were proposed: reconstruct the linoleum to match the aged and faded colours of the furniture, or reconstruct the linoleum 'as new', based on samples found in the FORBO archives. An important consideration is whether the reconstruction respects the original intensions of Rietveld, who designed the floor and furniture (and in fact the entire interior) as a unity. The concept of unity was especially important since the architecture of the room itself impeded a sense of unity due to its irregular shape, and awkward positioning of structural colums.
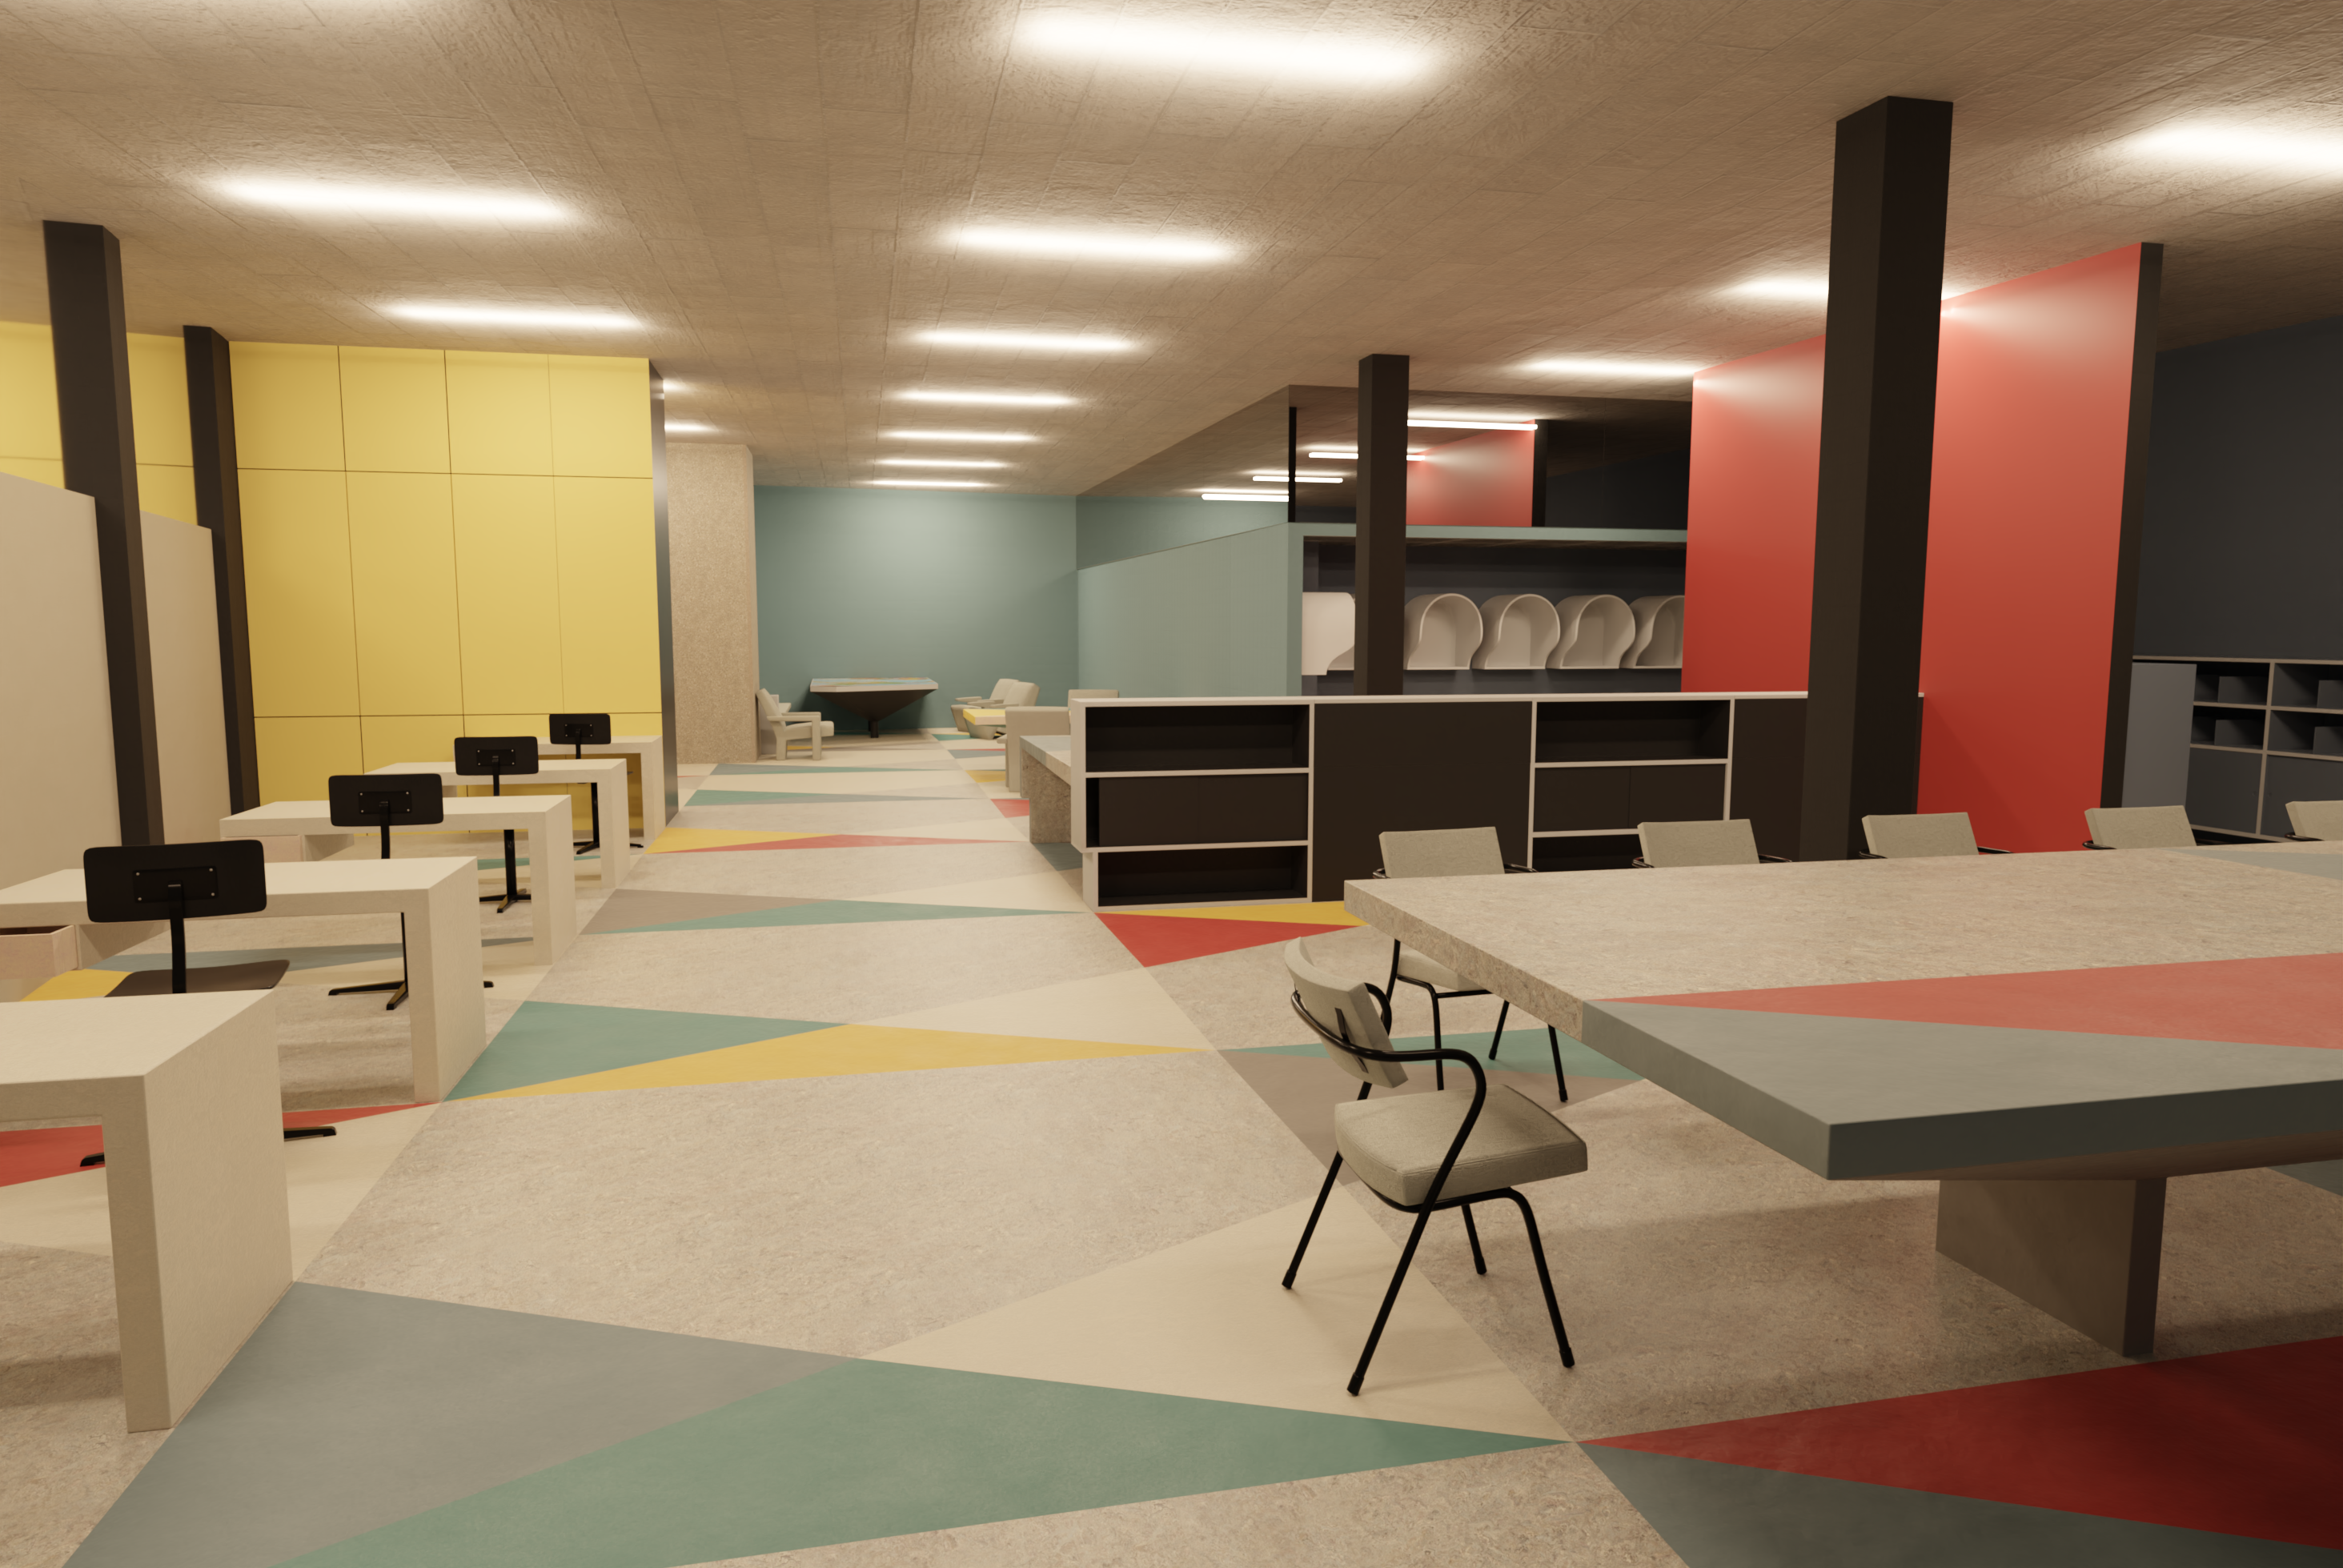
The UNESCO Pressroom, design and spatial divisions, render of the 3D model.
The digital 3D reconstruction of room and furniture
Although Santje's main focus was on the elements covered with linoleum, it was clear from the start that in order to to gauge the effect of certain choices on the perception of the room, the entire space had to be digitally reconstructed. This included features such as walls covered in different vinyls, wooden painted cabinets of various types, mirrors, windows, furniture with vinyl upholstry, concrete architectural elements, and of course the TL-lighting. A unique object was the so-called 'world-map table', a table with a light box type tabletop, which featured a map of the world. Fortunately, the original design drawings were preserved, as well as many (but not all) of the original objects. During modelling, the designs were compared with the photographic evidence and the preserved pieces in the depot, which reveiled only small divergences between design and execution. Hence, certain details aside, the reconstruction of shape and dimensions is generally of a high degree of certainty. As an added benefit of the modelling process, we gained some insights regarding certain design decisions by Rietveld, which we discuss in more detail in the project report.
Work in progress. Integrating the original paper designs with the model.
Reconstructing colour and gloss
For the reconstruction of the colours, we used colour measurements that Santje performed on the original linoleum samples and cleaned surfaces of the original furniture. The colour measurements were originally done with a X-rite Minolta i7 spectrophotometer, but we noticed that these diverged from the colours as measured on photographed samples, even though the light conditions of the spectrophotometer were matched by the studiolights. So we used both, to see if there was a noticeable effect on the reconstruction.
In restoration science, much attention is paid to accurate recovery of material properties such as colour and gloss of a surface. Subtle differences may detract from the experience of the authenticity of an object. However, accurate digital reproduction of these properties is not an easy task. The scientific approach would be to objectively measure colour and gloss, and then to enter these values into the 3D modelling program. This is not as simple as it seems. Colour is nothing more than certain wavelengths of light being interpreted by our brain, which 'colour-codes' it for us on the fly. This helps us to distinguish different kinds of objects. Colour perception varies across our species, so it is is very hard to objectively define colour. Also, colour is dependent on light: the same object has a different colour or tint under different environmental lighting conditions. So when we 'measure' colour, we basically measure a surface under specific conditions. Usually, this is 'daylight', which is a soft whitish light that we arbitrarily define as 'neutral'. However, in 3D modelling programs you create another virtual environment with lamps with specific properties, which means that the surface with the measured colour value is lit again, but under different conditions (in the case of the Pressroom: TL-lighting), creating yet another colour. And it becomes even more complex, since we also have to deal with the fact that there exists no single system to store and represent colour ('colour spaces'), and the digital model we use on devices (RGB) is a strong simplification of our own perception. Long story short, to match the colour and appearance of an object in a 3D program with simulated lights is ultimately a subjective process of trial and error.
Gloss on the other hand is basically the result of the microscopic roughness or bumpiness of a surface. The rougher a surface is, the more light gets dispersed, the more matt a surface appears. The smoother it is, the more it reflects light back to the observer. The smoothest surfaces are mirrors. There are devices that measure gloss, which was used by Santje in her material study. However, the resulting values cannot be simply entered in the 3D program we used (Blender), since it uses an entirely different model for computing gloss. So our method was to closely observe the original linoleum samples and linoleum floors in the real world, and try to match this in the 3D modelling program.
Historical linoleum samples on top of a modern linoleum floor. Photo by Santje Pander.
The effect of using a different colour measurement method. Left: RGB measurement on photos. Right: photospectometric measurement.
Photo of the Pressroom by UNESCO/D. Berretty.
Rendering
We created multiple renders with different material settings from the same perspective in order to compare the effects on the perception of the room. On purpose we chose a viewpoint that matched one of the historical photographs, so it was possible to compare this directly to the digital reconstruction. As the 1958 colour photos have known issues regarding the representation of colour, the marked difference was an interesting result that calls for reflection on how accurate our reconstruction is and how faded colour photos can cause a wrong impression of the original room.
The perceptual difference between the room in which modern alternatives of the colours are applied and those in which original colours are applied is especially striking. The difference between the images which show variations of the original colours ('as new', and 'aged'), is less perceivable. Although the actual RGB values are notably different when viewed next to each other in isolation, if applied in the room itself, differences are only noted after very close examination. It may be that the multitude of visual stimuli in the entire picture make it very hard for our brains to perceive small differences.
Render of the Pressroom from the same perspective as the photo. Colours based on colour measurement on original linoleum samples.
Reliability
The question remains whether these results are reliable enough to be used in the restoration decision-making process. There are multiple factors of uncertainty, the method of digital colour and gloss reproduction being an important one. Another factor is that we do not exactly know the original light conditions inside the room. We know that TL-lamps were used, but not exactly their power and light temperature. Based on these uncertainties, it can be argued that it is questionable that we have accurately recreated the interior. The model should therefore be considered as such, a working hypothesis about the physical appearance of a lost space. But we must not forget that an authentic recreation has in this case never been the aim. Moreover, it is quite unlikely that modifying the uncertain variables within reasonable bounds would have changed the outcome of the study significantly. Nevertheless, to model colour and lighting more accurately based on real world measurements, the digital methods we use also must improve.
Render of the Pressroom using colours available in the current FORBO collection, with a modern, glossy coating.
A virtual visit
The project got a nice spinoff in the form of an online 3D tour through the room, made in collaboration with the RCE. For this application we expanded the model to complete the room, and it was integrated with stories about the room from a design perspective. Of course, for this application we can only show one of the versions that we recreated. As a side note in respect to the above, the modifications and conversions necessary to be able to render the model in the browser create again a slightly different version of the room. This underlines the importance for us, researchers in the humanities, to understand and be transparent about the technical procedures and cognitive processes that lead to the creation of such digital 3D representations.
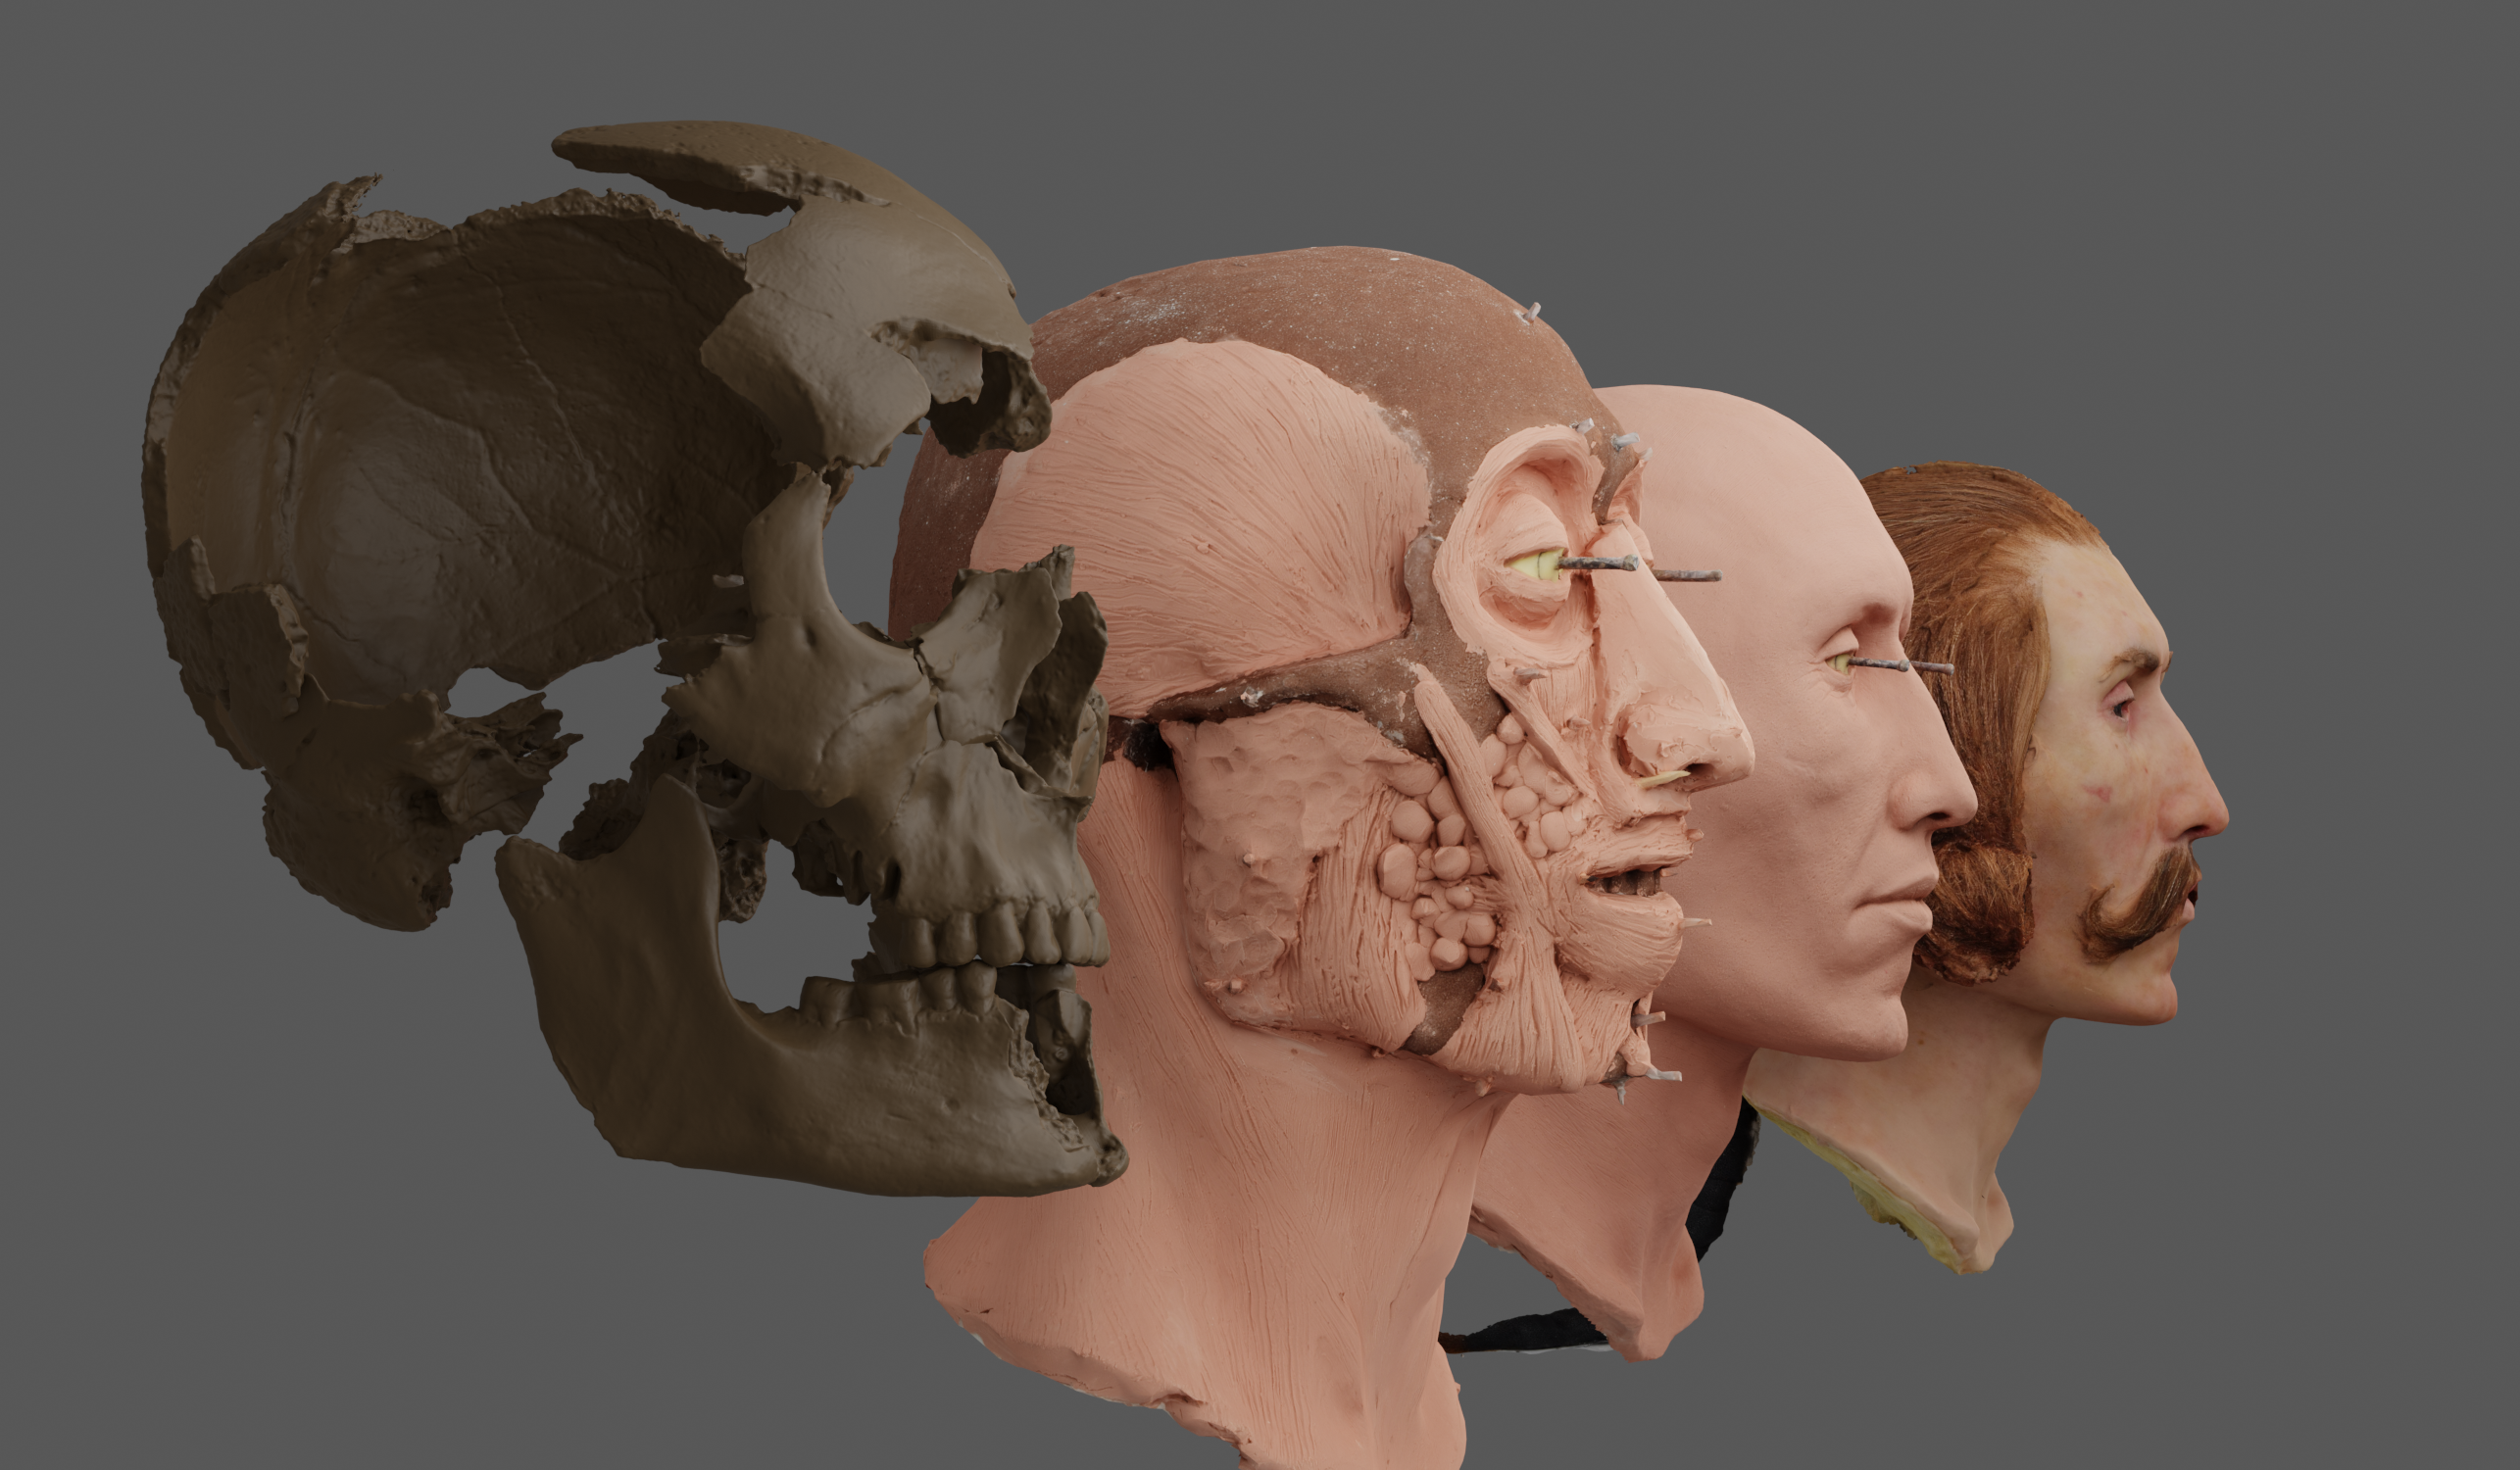
Render of the 3D scan of the original bone fragments and 3D models of the facial reconstruction by Maja d’Hollosy.
We have written about our Augmented Reality projects before, here, here, and here. But we never talked about one of our original case-studies that motivated us to start working with AR in 2018: visualizing the process of reconstructing a human face from fragments of an excavated skull of a Russian soldier who died in the battle of Castricum in 1799. This was an unfunded side-project, an experimental case meant to get to grips with AR technology, which is why it had been lying around nearly finished for over a year. But we finally got around to make an improved version, thanks to the spillover of lessons learned in the Blended Learning projects. In this post I’d like to discuss the project background and process of creation.
Battle of Castricum, 1799
In 1799 a war took place in Holland that we don’t learn about in Dutch history class in school, hence referred to as ‘the forgotten war‘. The Dutch were under French rule, and their joint armies clashed with those of Great Britain and the Russian Empire in the dunes near Castricum. The casualties were high and many soldiers found their death in these dunes. They were buried there in simple graves, wearing their uniform. Occasionally, a grave is found by accident and excavated. The nationality of the soldier can usually be derived from buttons, the only surviving pieces of the uniform.
Visualizing archaeological interpretation
The reconstruction of a face based on an excavated skull is an intricate process that combines forensics, archaeology, and anatomy with the art of sculpting. When so many disciplines are involved, some already rare in itself, it may not be surprising that this skill is not widely spread amongst humanity. Nevertheless, it is an extremely important aspect of our study of the past, as it gives a face to people who lived many years ago in societies we only know from their material remains. One of the people with these skills and expertise is Maja d’Hollosy, who works at ACASA as a physical anthropologist, but is also a freelance facial reconstruction artist. Her work has been featured in many archaeological exhibitions in the Netherlands and even on national television. The popularity of these reconstructions is not hard to fathom: there is something magical about looking in the eye of a person who lived thousands of years ago, modelled to such a degree of realism that it is hard to distinguish from a real person.
But these kind of reconstructions are often met with questions from the public: how do you know how a face looked like just by studying the skull? Would this person really have looked like this? This sure is very speculative? These are valid questions, that in fact pertain to all archaeological interpretation: how can we be so sure? As we often can’t, the least we can do is to be honest about our method and assumptions. In the case of the physical anthropological method of facial reconstruction, this is certainly not a complete gamble. Human facial features strongly correlate with the underlying bone structure, and facial reconstruction is for a large part a matter of applying statistics on muscle and skin thickness. On the other hand, skin colour and facial hair cannot be read from the bones of course.
Still, this part of our work, the art of reconstruction and interpretation, remains often underexposed in public outreach. The usual excuse is that ‘the public’ isn’t interested in learning how we got there, they just want the final picture. We don’t think this is true, at least not for all of the public. Loeka Meerts, an archaeology student at Saxion, University of Applied sciences, did a study into the possibilities of using AR for presenting archaeological facial reconstructions, and found that over half of the respondents (n = 42) were interested in learning more about how these facial reconstructions are made.
This is where we believe Augmented Reality can come to play a role. AR offers a way to enrich and superimpose reality with a layer of additional visual information. So why not use it to visualise the process of interpretation on top of a target object, the reconstructed fact?
The idea
The aim of the AR is to visualise the steps taken by Maja for the reconstruction of a face, from archaeological remains to full reconstruction including skin colour and hair. The basic mechanism is very simple: a user points a mobile device at a target, a 3D printed version of the reconstructed skull, and the original fragments of the incomplete skull appear on top of it. From then on, the user can swipe his or her way through the process of facial reconstruction. The user can walk around and view the reconstructions, digital 3D models of Maja’s work, on all sides. The videos on the side demonstrate the app.
Video 1: the AR in action on the original 1:1 target.Video 2: the AR on the smaller keychain target.
3D scanning and photogrammetry
To make this possible, we needed 3D models of each of the steps in the reconstruction. The original bone fragments had already been scanned with a high resolution 3D scanner (the HDI advance R3x ). Maja needed this scan for a 3D print of the fragments, which she used as the foundation for the sculpting process. Next, we chose six steps that are essential in the facial reconstruction process:
the reconstruction of the fragments into a complete skull
the placement of tissue thickness pins
the modelling of muscle tissue
the application of skin
the colouring of the skin
the application of (facial) hair
Each of these steps was recorded using photogrammetrythe technique of creating 3D models from a series of photo's. About 140 photos were taken in three circles around the subject. This number of photos give good quality high resolution 3D models with no occluded parts. The photos were processed in Agisoft Metashape. The sculpts are easy photogrammetry subjects, as they have much detail that can be used by the software to match photos, and they contain hardly any shiny or transparent parts. The results were generally very good, although a problem does exist with some of the transparent tissue thickness pins of step 2. Also, hair is a notoriously difficult material to reconstruct photogrammetrically, so the last step did not come out the neatest. All such issues could of course be fixed with manual tweaking of the models in 3D modelling software. However, correcting such defects, especially the hair, requires manual editing of the 3D model and textures, which is quite a time-consuming task. So we left that for another moment.
The photogrammetrical reconstruction results in very dense mesheshigh resolution 3D models, which need to be simplified for display in an app that should run on a phone. Each scan was thus decimateddecimation is the process of simplifying the 3D model to 50.000 faces. Still a sizeable number, but it is manageable by most devices. Although you lose geometric detail, this is hardly noticeably as the generated photo-textures bring back all visual detail. Besides photo-textures, also ‘normal’, and ‘ambient occlusion’ maps were generated based on the high resolution models. These are used to create the illusion of depth on the small scale, such as bumps and pores of the skin, which were lost due to the decimation process.
The AR app
The next step has been to create the Augmented Reality application. The AR software we used was Vuforia. Vuforia is an AR engine, which means it just takes care of the target recognition. To display the 3D models and to build user functionality, you need a game engine. Vuforia is well-supported by the Unity game engine, so Unity was a logical choice. The reason for choosing Vuforia, was that in 2018 it had just introduced an exciting new feature: 3D object recognition. In older AR, you would need a 2D image or QR-code, to act as trigger and target for the placement of the AR model. With 3D object recognition, you use a 3D model of the actual object as a trigger. This does not work out of the box. You need a 3D model of the physical target, and if you want 360-degree recognition, this has to be run through a ‘training session’. This is basically a machine-learning algorithm that analyses the object and stores a series of target images in a database. This database is imported in Unity, where you set up an AR camera and lighting, the 3D models, materials, and program user interaction. The latter was done by Markus Stoffer, student assistant at the 4DRL and specializing in AR/VR.
The target that we used is a 3D model of the first step in the facial reconstruction, the bone fragments reconstructed to a complete skull. The target was 3D printed in PLAPolyactic Acid, a plastic on the Ultimaker 2+, and painted in skull-colours afterwards.
Photographing the skinned reconstruction. Photo by Maja d’Hollosy.
Photogrammetric reconstruction of one of the steps.
3D print of the target, as it came out of the printer.
3D print of the target painted and mounted.
Unity game engine environment.
The 3D models used in the AR application.
Improvements and the future
In the current app a user simply skips between the steps that show the process of facial reconstruction. Because the original focus was on learning how to work with Vuforia/Unity, and to create a nice AR example that we could easily show-case in the lab, we did not add an informative layer. For use as an educational tool in a museum environment, this could be a useful next step. Adding text, or probably better still, audio, giving background information about the steps taken by the sculptor, is a relatively small effort. The curator at Huis van Hilde, the museum which houses the archaological finds and the reconstruction of the Russian soldier, has shown interest in exploring options for the actual implementation in the exhibitions.
An interesting question is whether an AR app satisfies the needs of a museum audience. In Loeka Meert’s survey, museum visitors were interviewed about their preferred medium of learning more about the reconstruction. Only 20% of the respondents chose ‘an app on their phone’, while the largest percentage of interviewed museum visitors (41,40%) chose to be informed through a digital screen next to the face reconstructions. It is likely that familiarity with digital screens in a museum setting as opposed to AR apps influenced the outcome of the survey. Regardless of the causes, to make visitors use new innovative technology requires a seamless user experience.
In that respect, one element that should certainly improve is the target recognition. For instance, we have been struggling to get the smaller keychain model target (see video above) to work. It appears that the size has an impact on the recognizability, but why and how this works remains unclear. Vuforia’s algorithms are closed-source, and it is hard to see what exactly is causing problems. Also our other experiments with AR in a museum showed that target recognition and visual stability was an unpredicable factor and varied from object to object. However, target recognition and visual stability of the augment are very important elements when it comes to user experience. In that sense the AR technology still has some way to develop before 3D object recognition can function without problem on our mobile devices.
We finally got around writing up the 4D Research Lab approach on 3D visualisation. For the use of virtual reconstruction in the context of academic research, it is paramount to have a clear conception on both the modeling process as well as the final result, and communicate this as well as possible. Thorough research, responsibility, transparency and verification are key-concepts here. For the 4D Research Lab principles and standards, this amounts to:
A principle statement, in which we define the role of 3D visualisation in academia, our views on academic rigour, accessibility and sustainability. As for academic rigour, we build forth on “The London Charter for the computer-based visualization of cultural heritage” and the “Principles of Seville, international principles of virtual archaeology”.
A template, which is the application of the principle statement into a standard format for execution and documentation of 3D visualisation projects, and compiling reports.
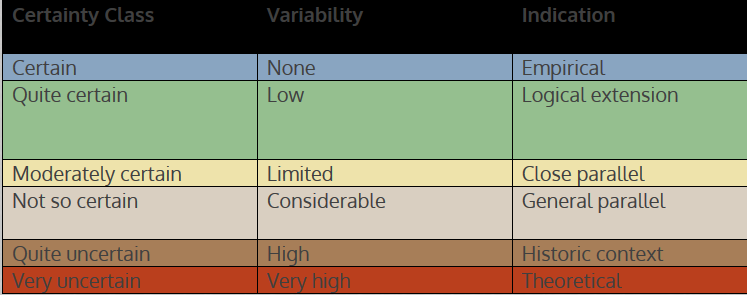
A definition of our take on dealing with (un)certainty in 3D visualisation, accompanied with a 6 degree classification of certainty levels.
These standards and principles will be applied to all projects of the 4D Research Lab to ensure uniformity but also to create a database to be able to compare their performance. Surely, in due course we will find that we might improve on our project template or classification of (un)certainty. We do not consider them written in stone, but as a culmination of our experience so far, and they will surely be susceptible to future evolution into better versions of themselves.
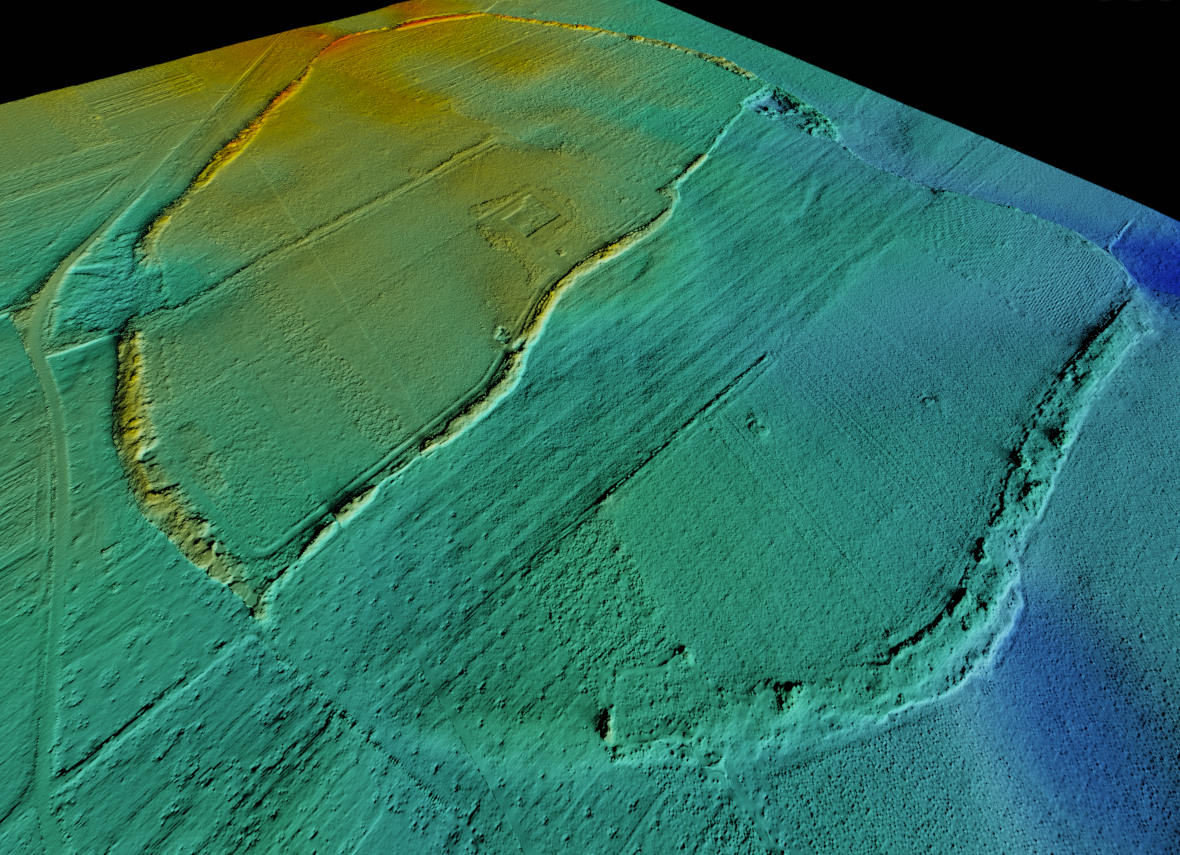
Over the last decade, high resolution elevation data from LiDAR surveys has lead to much better understanding of archaeological features. 4D Research Lab coordinator and ACASA researcher Jitte Waagen has been experimenting with a number of visualization techniques to study the site of Muro Tenente in Apulia, Southern Italy. Muro Tenente is a vast defensive circuit dating to protohistoric (pre-Roman conquest) times that has been under investigation by archaeologists of the Vrije Universiteit Amsterdam.


